![]()
DIVISION: Capital Planning & External Affairs
BRIEF DESCRIPTION:
Presenting for adoption the Final Draft Amendment to Muni's FY2002-2021 Short Range Transit Plan.
SUMMARY:
· The Short Range Transit Plan (SRTP) is Muni's primary planning document.
· This SRTP Amendment serves to comply with a settlement agreement in the case of Bayview Advocates v. San Francisco Municipal Railway.
· The SRTP Amendment analyzes 20 projects for potential ridership increases, capital and operating costs, and demographics, and prioritizes them in our Capital Improvement Program, as required by the settlement agreement.
· A four-week period of public review was held from October 10, 2002 to November 8, 2002.
· A summary of changes made to the document is attached, as well as a summary of comments received during the public review period, and the staff response.
ENCLOSURES: (list numerically and by title)
1. Summary of Changes made to Draft Amendment, including public comments with staff responses, and other updates made by staff.
2. Final Draft SRTP Amendment for Adoption
3. Resolution
EXPLANATION:
This item presents for adoption an Amendment to the FY2002-2021 Short Range Transit Plan (SRTP). It also includes a summary of changes that were made to the Draft Amendment, including public comments made during the public comment period and the staff response to the comments. The SRTP is Munis primary planning document, and it presents Munis future service plans, service standards, Capital Improvement Program (CIP), and operating financial plan in a public document. The Metropolitan Transportation Commission (MTC) requires Muni to produce an SRTP every two years, and the MTA Board adopted Munis last SRTP update in August 2001.
Muni produced this SRTP Amendment in response to a settlement of a lawsuit brought by Bayview Advocates and other non-profit groups. The lawsuit alleged that defendants MTC, Alameda-Contra Costa County (AC) Transit, and Muni violated the Clean Air Act by non-compliance with a transportation control mitigation measure (TCM2) of the 1982 Bay Area Air Quality Plan. The court determined that TCM2 required a 15% regional ridership increase within five years of 1982. AC Transit and Muni have settled with the plaintiffs; MTC plans to appeal the courts decision.
As required under the settlement agreement, Muni hired a consultant (Nelson\Nygaard) to perform a ridership analysis of 20 projects contained in Munis Vision for Rapid Transit document. The results of the Nelson\Nygaard analysis have been incorporated into the SRTP Amendment. In addition to containing the ridership analysis, the SRTP Amendment provides capital and operating costs and demographics for the projects, and prioritizes them in Munis CIP.
The Draft SRTP Amendment was released for a public comment period that started on October 10, 2002, and closed on November 8, 2002. Comments were received from 15 citizens, agencies, and community organizations. Included with this item is the Summary of Changes, which lists changes made to the document since the Draft Amendment was presented. This Summary also lists comments that were received from members of the public on the Draft SRTP Amendment during the public comment period and staff responses to those comments. In most cases, clarification or further information was provided as a result of the public comments.
SRTP Amendment Schedule
The SRTP Amendment went through a comprehensive approval process that included extensive review by Muni staff and a four-week public review and comment period. Some of the major milestones in producing the final document were:
· Muni Staff Review: September 2002
· Release of Public Draft: October 10, 2002
· Public Comment Period: October 10 to November 8, 2002
· Presentation of Draft SRTP Amendment to Citizens Advisory Council: October 21, 2002
· Public Hearing on Draft SRTP Amendment at MTA meeting: November 5, 2002
Staff requests that the MTA Board adopt the Final Draft Amendment to the FY2002-2021 Short Range Transit Plan. The Amendment will be submitted to MTC for funding consideration by December 31, 2002, as required by the settlement, and incorporated into the FY2004-2023 SRTP.
The City Attorney has reviewed this calendar item and the attached resolution.
MUNICIPAL TRANSPORTATION AGENCY
CITY AND COUNTY OF SAN FRANCISCO
RESOLUTION NO. _______________________
WHEREAS, Under a settlement agreement with the plaintiffs in a lawsuit entitled Bayview Advocates v. San Francisco Municipal Railway, the City and County of San Francisco, through its Municipal Transportation Agency (Muni), was required to analyze 20 projects for current and future ridership, capital and operating costs, demographics, and implementation schedules, and incorporate the analysis into an amendment to Muni's FY 2002-21 Short Range Transit Plan (SRTP); and
WHEREAS, The Municipal Transportation Agency Board of Directors (MTA Board) conducted a public hearing on the Draft SRTP Amendment on November 5, 2002; and
WHEREAS, Muni staff presented a Summary of Changes to the MTA Board, which lists the changes made to the Draft SRTP Amendment, the comments received during the public comment period, and the responses to the public comments; and
WHEREAS, Muni staff has prepared a Final Draft SRTP Amendment; now therefore, be it
RESOLVED, That the MTA Board adopts the Final Draft Amendment to the FY2002-2021 Short Range Transit Plan and directs staff to submit it to MTC for funding consideration by December 31, 2002.
Amendment to
FY2002 - FY2021
Short Range Transit Plan
Final Draft for Adoption
December 3, 2002
San Francisco Municipal Railway
Municipal Transportation Agency
Michael T. Burns, Executive Director
A. The Short Range Transit Plan Amendment
B. A Vision for Rapid Transit in San Francisco
C. Relationship to Other Plans/Projects
III. Capital Improvement Program
Appendix A: Ridership Methodology
Appendix C: Detailed Demographic Analysis
Figures
Figure 1: Projects Listed in Settlement
Figure 2: Vision Corridors Map
Figure 4: National Transit Database Operating Costs
Figure 10: Funding Needs Summary
![]()
Every two years, the San Francisco Municipal Railway produces a Short Range Transit Plan (SRTP) as its primary planning document. The SRTP describes Muni's organization, current and planned services, the capital improvement program, and the financial operating plan. Muni staff, the San Francisco County Transportation Authority (SFCTA), the Metropolitan Transportation Commission (MTC), the Federal Transit Administration (FTA) and other agencies use the SRTP to clearly see what Muni's top priorities are, what is planned for the future and how Muni intends to accomplish its goals and objectives. The Municipal Transportation Agency Board (MTAB) adopted the 2002-2021 SRTP in August 2001.
This document is an Amendment to the FY2002-2021 SRTP. Muni produced this Amendment in response to a settlement agreement with Bayview Advocates. Bayview Advocates and other community groups filed suit against Muni, Alameda-Contra Costa County (AC) Transit, and MTC in February 2001 alleging that the defendants violated the Clean Air Act by failing to comply with TCM2 of the 1982 Bay Area Air Quality Plan.
Figure 1: Projects Listed in Settlement
| A. Electrification of 47-Van Ness |
| B. Electrification of 9-San Bruno |
| C. TPS treatments for J-Church from Duboce Portal to 30th Street |
| D. TPS treatments for K-Ingleside from St. Francis Circle to Green Terminal |
| E. TPS treatments for L-Taraval from West Portal to Wawona/46th Avenue |
| F. TPS treatments for M-Ocean View from St. Francis Circle to Green Terminal |
| G. TPS treatments for N-Judah from Duboce Portal to La Playa |
| H. TPS treatments on Fillmore |
| I. TPS treatments on Market Street from Castro to The Embarcadero |
| J. TPS treatments from Stockton/Market to the Presidio through North Beach and the Marina |
| K. TPS treatments on Geneva and Ocean from Junipero Serra to Bayshore/Sunnydale, including exclusive ROW for K |
| L. TPS treatments on 19-Polk route to Hunters Point |
| M. BRT on Potrero and TPS on San Bruno |
| N. BRT on Geary from Pacific Ocean to Van Ness, and TPS to Transbay Terminal |
| O. BRT on Van Ness and TPS on Mission |
| P. Terminal loop for historic E-line on The Embarcadero |
| Q. BRT on Folsom from The Embarcadero to 16th Street |
| R. BRT on 19th Avenue and Park Presidio from Stonestown to Lake |
| S. Electrification of 19-Polk |
| T. BRT on 16th Street, including electrification on 16th Street |
The settlement agreement identified 20 projects for further development. Muni agreed to analyze the projects for potential ridership increases, develop capital and operating cost estimates and an implementation timeline, and perform a demographic analysis of the areas served by the projects. The projects are prioritized in our Capital Improvement Program (CIP) according to established criteria and with consideration to potential ridership effects. The agreement specifies that these projects are not to take funding from existing or planned projects that are ranked higher using our established criteria. The projects in the form of this SRTP Amendment will then be submitted to MTC for funding consideration. This Amendment will be incorporated into the 2004 SRTP.
The project descriptions and analyses are intended to be the beginning of a project development process. If funded, each of the projects will go through a formal analysis, including technical feasibility and traffic impacts. As with all Muni efforts, project development will also involve a great deal of work with members of the community, other stakeholders, and City agencies.
Proposition E, approved by San Francisco voters in 1999, changed Muni's governing structure and implemented service standards intended to advance Muni's operating efficiency and effectiveness. The next step toward achieving the vision embodied in Proposition E is to develop and fund a long-range capital plan that details Muni's service requirements over a 20-year time period and the transit improvements needed to satisfy those requirements.
The projects listed in the settlement are taken from A Vision for Rapid Transit in San Francisco, published by Muni in February 2002. This document is Muni's vision of what a high-quality transit system for San Francisco might look like. The system would be one that moves our riders quickly and efficiently throughout the City with a minimum of waiting. It would be a high capacity, easily accessible, rapid transit style service. It would enable riders to transfer easily between Muni lines as well as to BART, Caltrain, ferries, and other interregional transit services.
This enhanced and expanded system would attract more people to public transit, taking cars off the road and freeing up street space for those necessary auto trips. It would help implement San Francisco's Transit First policy, which states:
Transit priority improvements, such as designated transit lanes and streets and improved signalization, shall be made to expedite the movement of public transit vehicles New transportation investment should be allocated to meet the demand for public transit generated by new public and private commercial and residential developments.
In formulating this vision, Muni invited major stakeholders to provide input on the approach that staff should take. The stakeholders included transit advocates, the SFCTA, other City agencies, business interests, and representatives from other operators such as BART and Caltrain. Staff held a workshop for these stakeholders on March 1, 2001, where they helped shape a set of guiding principles and identified major corridors that are candidates for service improvements.
The stakeholders formulated four guiding principles to direct Muni's system growth over time. As decisions are made about the types and locations of resource investment, these principles will help prioritize competing interests:
Integrate local and regional transit into a seamless transit network. A seamless transit network minimizes transfer wait times and coordinates scheduling with non-Muni transit providers. Because jobs and housing will become more and more dispersed around the region, more San Franciscans will work outside the City and require connections to regional transit such as BART and Caltrain. The overall trip will be longer, so it is even more critical that the local segment of the trip be fast and reliable.
Physically separate transit service from automobile traffic on major corridors by creating exclusive rights-of-way (ROW) where possible. In non-exclusive, mixed traffic conditions, traffic congestion is a major source of delay for Muni vehicles, resulting in increased travel time and decreased reliability. Transit-only diamond lanes are often blocked by private automobiles turning right or double-parked, so are not effective without vigilant enforcement. A physically separated right-of-way is more effective at protecting transit vehicles from congestion and allowing them to stay on schedule. Implementing this policy would involve prioritizing transit use over private automobiles in order to maximize the street's capacity.
Provide high-capacity, rapid transit-style service in major corridors. There are a number of major corridors in San Francisco which have high volumes of riders and which suffer from chronic capacity and reliability problems. These issues, combined with the high levels of ridership, justify a greater investment in these corridors to establish high capacity rapid transit. This could be rail or rubber-tired transit in an exclusive right-of-way, surface or subway, with faster boarding and wider station spacing.
Upgrade transit service in increments as ridership builds and as funding becomes available. Because funding is limited and proposed projects cannot all be built at once, it is important to take incremental steps so that multiple corridors can be improved simultaneously. For example, building an exclusive ROW for Bus Rapid Transit (BRT, described below) can be done as a first step, with light rail replacing BRT as more funds become available.
The major corridors identified are those paths of travel in San Francisco that have high volumes of riders, serve major destinations and neighborhoods, and are anticipated to see some growth in ridership. Some of these corridors are currently served by rail; others by motor coach or trolley coach.
The list begins with the corridors identified in the SFCTA's 1995 Four Corridors Plan: Third Street, Geary, Van Ness, and Chinatown-North Beach. Muni completed a Geary corridor study in 1995, and is moving forward with implementation of LRT in the Third Street corridor.
Stakeholders at the March 2001 workshop expanded the list of corridors to include those with heavy ridership and operational issues (Market Street, Fillmore-16th Street, Potrero-San Bruno). The stakeholders identified others that balance geographic coverage across the City (Geneva-Ocean, 19th Ave-Park Presidio) and those in which significant ridership growth is expected (Embarcadero, Hunters Point, SOMA). The workshop also addressed the need for improvements in existing rail corridors to provide more rapid-transit style service.
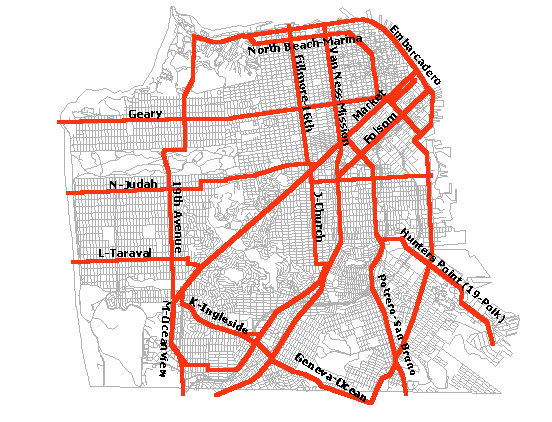
Figure 2: Vision Corridors Map
Muni developed a "toolbox" consisting of various levels of improvements that can be implemented with varying amounts of funding. The tools range from relatively low-cost Transit Preferential Streets (TPS) improvements to light rail in an exclusive subway right-of-way. This toolbox allows us to assign appropriate improvements to each corridor, and allows for a multi-phase approach. The settlement agreement, confined to a five-year time frame, includes all but the rail projects, which typically take longer than five years to complete.
The TPS tool consists of a variety of low-to-medium cost treatments to speed transit vehicle flow. These can be implemented individually but are more effective taken together.
Electric trolley coaches are rubber-tired vehicles that are powered electrically from fixed overhead wires. Trolley coaches now generally operate in mixed traffic, but can operate in an exclusive ROW with signal priority, or in a subway. Trolley coaches produce zero emissions and are particularly effective on steep grades. Currently, 34% of Muni's revenue hours are operated by trolley coaches. Conversion to trolley coach operation is desirable in more locations system wide because they are quiet, clean vehicles that enhance the quality of life in an urban setting.
Limited and express services would remain operated by diesel coaches so they can pass vehicles on wire. The new trolley coaches can operate for short distances off-wire, but the mechanism for re-attaching to the wires is awkward and impractical for regular use. This would also add a substantial maintenance cost to both the overhead wires and the poles. Passing wire is also an option but requires a great deal more wires, switches, and hardware, as well as planning and design. It may be possible to operate limited and express services with trolley coaches when the technology and mechanics improve, but it is not being considered at this time.
There are many ways to define Bus Rapid Transit. In this report we generally refer to BRT as a rubber-tired vehicle operation that is configured to offer speeds and capacity similar to rail transit, with exclusive travel lanes, limited stops, and signal pre-emption. Other characteristics include the use of low-floor transit vehicles, a prepaid fare system that expedites boarding, and stations that provide shelter and passenger information. Because transit vehicles are separated from other vehicles and stop less frequently, travel time decreases. A full expression of BRT is the system in Curitiba, Brazil, which includes all of these features. BRT is appropriate in corridors with high ridership where there is sufficient ROW to provide dedicated lanes. BRT does not require as much capital infrastructure as LRT, and may serve as the first phase of implementing light rail transit.
Part of BRT's appeal is that it can attract more riders by providing more comfortable stations, newer vehicles, and other attractive features, in addition to better reliability and frequency. Indeed, the BRT project on Wilshire Boulevard in Los Angeles has increased ridership significantly on the route, using signal pre-emption, new vehicles, and passenger amenities, but not exclusive transit lanes. However, most of the improvement in travel time is due to widened stop spacing - the distance between stops increased from every 500 feet or so to every mile. While that solution has been effective in LA, San Francisco's relative density and shorter distances (the Geary corridor is seven miles long, while Wilshire is 27 miles) make that model less effective for Muni.
This SRTP Amendment is related to the 2002-2021 SRTP and a number of other related planning efforts that are described in the main SRTP document. In particular, this Amendment draws on information from the following plans and projects:
Muni's Route Electrification Study, a draft of which is currently available, details the priorities, issues, and concerns associated with the conversion of motor coach routes to trolley coach operation. The study outlines the benefits and drawbacks of electrification, criteria for conversion, routes being considered, and the implementation process and system requirements. For example, in addition to new vehicles, an expanded trolley coach fleet would require construction of overhead infrastructure, additional power systems, and new or converted facilities for operation and maintenance.
The electrification projects listed in the settlement are discussed in greater detail and prioritized along with the other candidates for conversion in the Route Electrification Study. Electrification projects are also part of Muni's effort to maximize alternative fuel operation.
As part of the Mission Bay Agreement with Catellus, San Francisco agreed to provide trolley coach service through the Mission Bay development by extending and rerouting several lines. These trolley coach service extensions are planned to meet the increased demand anticipated as the result of development in the Mission Bay area. The agreement with Catellus specifies that Muni will pay for all of the capital and operating costs associated with the extensions, but that Catellus must build the new streets and support structures required for the extensions. This project cannot proceed in advance of the street construction, which is not anticipated to occur until after 2010.
Two interrelated projects are expected first as a result of the Mission Bay agreement. One is extending the 45-Union-Stockton from the current southern terminus, through the Mission Bay development, and then via the current 22-line route on Potrero Hill to a terminal loop near Third and Mariposa streets. The other is rerouting the 22-Fillmore line to operate via 16th Street all the way to Third Street and then north into Mission Bay, instead of the current route across Potrero Hill. This change is not anticipated to require additional vehicles, but would require new overhead lines on 16th Street and is consistent with the project description in the settlement agreement.
The 45-line cannot be extended until the Mission Bay streets and infrastructure are built, so it is likely that the Mission Bay portion of the future 45-line will be served with a substitute "interim" route.
The Third Street Light Rail Line is a major vehicle and infrastructure project that will bring modern light rail service to the eastern side of the City. The light rail line will replace the 15-Third Street motor coach line, and is being implemented in concert with a community revitalization effort supported by numerous City departments, community groups, and other organizations. The primary purpose of the Third Street Light Rail Project is to accommodate existing and forecasted transit ridership within the corridor with greater reliability, comfort and speed, and to facilitate economic development opportunities along the corridor. Construction began in 2000 and the line is expected to open in 2005.
Phase 1, the Initial Operating Segment (IOS), will extend Muni Metro light rail service south from its current terminal at Fourth and King streets. The line will cross the Fourth Street Bridge and run along Third Street and Bayshore Boulevard, ending at the Bayshore Caltrain Station in Visitacion Valley. The 5.4 miles of new rail will be constructed primarily in the center of the street to improve safety and reliability and 19 stops will be provided. The IOS is projected to carry 71,000 daily riders in 2015. Travel times from Visitacion Valley to Market Street will be reduced by up to 11 minutes.
Phase 2 of the Third Street project, the Central Subway, is scheduled to open in 2009, extending light rail service through SOMA, Union Square, and into Chinatown. In addition to providing much-needed capacity in the Chinatown area, the Central Subway will provide direct connections between SOMA, downtown and Chinatown and the southeast part of the City, Potrero Hill, and Mission Bay. This project is listed in Track One of the Regional Transportation Plan (RTP) and is currently in the federal New Starts process. It is possible that, as a result of this project, the 30 and 45-lines will experience less demand than today, due to the diversion of riders to the subway. The development of the TPS improvements along the Stockton/Columbus corridor will be informed by the discussions and planning of the Central Subway project.
The City has a new Integrated Transportation Management System (ITMS) led by the Department of Parking and Traffic (DPT) to provide centralized traffic management. Phases of the project will be implemented over the next several years to make City streets more effective and safer through the use of Intelligent Transportation Systems (ITS) technologies, consistent with the regional ITS architecture. Travelers can expect signals that respond to the actual volume of traffic on a roadway, faster response by City personnel clearing an incident, real-time information on travel conditions, and improved coordination among all modes of transportation. The program complements San Francisco's Transit First Policy by helping to preserve and enhance the City's alternate modes of transportation. The initial phase, in the SOMA area, costs approximately $8 million and is scheduled to be operational by the end of 2003.
When fully implemented, this project will be a critical component of TPS improvements. Principal benefits to Muni will be 1) improved management of traffic around special events, accidents, or construction; 2) traffic prioritization along key corridors, which can be adjusted real-time to match traffic loads; and 3) improved passenger information that combines traffic and transit information. Muni is participating in the project's Technical Advisory Group and coordinating directly with DPT on the Third Street project (installing fiber-optic on Third Street) and the AVL project (providing transit vehicle information).
The SFCTA's Countywide Transportation Plan (CWTP) prioritizes investments in San Francisco's transportation system over the next 30 years. The Plan also guides advocacy for new transportation revenues at the local, regional, state and federal levels, and serves as a blueprint for the reauthorization of the half-cent sales tax approved by San Francisco voters in 1989. Muni is working with the SFCTA to incorporate CIP and settlement projects into the CWTP in four categories: Maintenance & Rehabilitation, Major Investments, Early Pay-off, and Supporting Projects. The SFCTA is evaluating travel needs throughout the City, forecasting future mobility changes, and assessing the performance of proposed projects based on need, cost, and funding. A draft for public review is expected later this year.
Muni's work on this SRTP Amendment is also consistent with the Planning Department's efforts citywide, specifically, the Citywide Action Plan (CAP), which is the core of the long-range planning division's work program over the coming years. The component of the CAP that supports Muni's efforts most directly is the Civic Streets & Transit initiative. That initiative, informed by Muni's Vision for Rapid Transit, lays out a vision for a more contemporary approach to street design and management that supports transit and balances the needs of all modes of transportation. Muni is working with the Planning Department and other City agencies to coordinate these visions and manifest them in practice, including redefining street engineering standards and practices.
The Planning Department's Better Neighborhoods program also affects and is affected by Muni's current efforts. In the past two years, the department has developed specific plans in three transit-rich neighborhoods: Balboa Park, Central Waterfront, and Market/Octavia. The plans encourage higher densities of housing and development in those areas because they have good transit service and other amenities. The plans also seek to facilitate transit-oriented mixed-use development in order to increase transit ridership and enhance neighborhoods. The plans are supportive of transit improvements included in this plan, including BRT on Van Ness and TPS on Mission (Market/Octavia plan) and TPS treatments for the J, K, and M lines (Balboa Park plan).
The Geary Corridor is a specific planning initiative of the CAP, and will be coordinated fully with the proposed BRT project on Geary.
The agreement calls for analysis of 20 projects for current ridership and possible increases, capital and operating costs, and demographic data. The areas of analysis and methodologies are summarized first, and then the projects are discussed in detail. This section also discusses a number of systemwide improvements not mentioned in the settlement agreement but which could increase ridership substantially.
Current ridership numbers are taken from the FY2002-2021 SRTP and date from 2000-01. The average weekday numbers are annualized using a factor of 313. All costs are in 2002 dollars.
The settlement requires Muni to analyze the 20 projects for potential ridership gains, and an independent consultant performed this work. Ridership is expected to be influenced by travel time, frequency, reliability, and the availability of real-time passenger information. Numerous studies have established a quantitative relationship between the demand for public transportation (i.e., ridership) and a number of changes in service, including travel time. Elasticity is a well-documented measure of the relationship between travel time, for example, and ridership, and is expressed as the percent change in ridership for a given percent change in travel time. The references used for this analysis include are the TCRP Handbook (Pratt, Traveler Response to Transportation System Changes, prepared for TCRB, 2000) and the CM/AQ Evaluation Model, by JHK & Associates for Texas Transportation Institute, 1995. The consultants used existing Muni data and well-documented elasticities for those operating characteristics to estimate ridership growth. A detailed description of the ridership methodology can be found in Appendix A.
Dedicated transit ways included in the BRT projects provide reduced travel times as compared with the existing system. These improved travel times will result in increased ridership in the affected corridors. Greater frequency of service is also found to have a correlation with increased ridership.
Of the three BRT projects, the Geary project attracts the largest number of new riders, while the Van Ness project is estimated to attract fewer riders but a greater percentage of its existing ridership. The project on 19th Avenue, because it did not have as large an impact on travel time, attracts the fewest new riders of the BRT projects. These are new riders to the system, not existing Muni riders who are attracted to these routes from other Muni routes.
The TPS projects, which do not include dedicated transitways, will nevertheless improve the reliability of the routes to some extent, and therefore have an effect on ridership. Reliability, which is overwhelmingly important to ridership, is very difficult to measure using proven elasticities. However, the consultants used their knowledge of the Muni system to make rough estimates of the relative level of impact of different reliability improvements as they affect the ridership of an entire line. The consultants conservatively estimated ridership growth of 1-5% on an entire line as a result of reliability improvements.
These estimates are designed to be applied to an entire line, even though the improvement may more directly affect only one part of a line, primarily because reliability improvements, like reliability problems, flow down the length of a line. If a group of buses become bunched due to an obstruction at one point, they are likely to remain bunched for the length of the line, reducing service quality for riders well beyond the spot where the problem occurred. For this reason, the projects aimed at increasing reliability are expected to have benefits beyond the specific segment affected.
Some projects do not have measurable ridership increases. Electrification, by offering a quieter and more comfortable ride, could attract new riders solely on the basis of this amenity, but when electrification is considered in isolation, without changes in route, frequency, or reliability, this benefit is too small to be the driving motivation for ridership increase. Sometimes, when a line is converted to electric operation, it becomes more reliable and attracts riders simply because the vehicles are newer. There is some evidence that ridership increased when a route was electrified, but electrification occurred in conjunction with other service changes or in response to other changes unrelated to transit service, so it is difficult to assign the ridership increase or decrease to the mode. Further study is needed.
Finally, the consultants analyzed the effects of real-time passenger information systems on ridership levels and found a 5% increase attributable to the presence of such a system on a line. This estimate is based on data from several European peers, where ridership gains of about 5% have been found in several applications that are comparable to San Francisco. The ridership estimates show the effect of this increase separately for each corridor studied, but the real-time information system can be implemented independently of the corridor projects. As discussed below, Muni's project to implement real-time information systemwide is not fully funded.
Ridership figures were also estimated for 2006 assuming no projects. Regionwide ridership has decreased in the last two years, and evidence from transit operators across the U.S. suggest that transit ridership will not increase this year. For this reason, no-project ridership is assumed to remain level in 2001 and 2002 and then increase at 1% until 2006. The estimated ridership gains due to the projects analyzed are added to the 2006 no-project ridership numbers to arrive at the estimated annual ridership with project. These ridership figures are shown in Figure 3.
It should be emphasized that the ridership estimates developed at this stage are considered very preliminary, planning level estimates, and are not to be considered a "guarantee" or a substitute for the more rigorous analysis that will be required as part of any environmental assessment of these projects.
| Project | Existing Annual Ridership (2000) | No-Project Ridership (2006) | Annual New Riders with Project | Annual Ridership with Project (2006) |
| Geary BRT | 14,681,578 | 15,277,709 | 2,098,352 | 17,376,061 |
| Van Ness BRT | 8,210,929 | 8,544,326 | 1,624,157 | 10,168,483 |
| 19th Avenue BRT | 4,522,850 | 4,706,496 | 316,443
|
5,022,939 |
| Stockton-Columbus TPS | 14,326,636 | 14,908,355 | 655,735 | 15,564,090 |
| N-Judah TPS | 12,222,963 | 12,719,264 | 611,289 | 13,330,553 |
| L-Taraval TPS | 8,829,417 | 9,187,927 | 264,798 | 9,452,725 |
| M-Ocean View TPS | 8,791,544 | 9,148,516 | 351,812 | 9,500,328 |
| Potrero-San Bruno TPS | 5,778,293 | 6,012,915 | 173,402 | 6,186,317 |
| Fillmore-16th TPS | 7,665,683 | 7,976,940 | 306,740 | 8,283,680 |
| K-Ingleside TPS | 5,661,231 | 5,891,100 | 282,952 | 6,174,052 |
| J-Church TPS | 4,281,840 | 4,455,700 | 171,211 | 4,626,911 |
| 19-Polk TPS | 3,971,970 | 4,133,248 | 79,502 | 4,212,750 |
| Geneva TPS | 5,778,293 | 6,012,915 | 57,592 | 6,070,507 |
| Market TPS | ||||
| Folsom TPS | 1,198,790 | 1,247,466 | 24,101 | 1,271,567 |
| 47-Van Ness Elec. | 2,113,689 | 2,199,513 | 0 | 2,199,513 |
| 9-San Bruno Elec. | 5,778,293 | 6,012,915 | 0 | 6,012,915 |
| 19-Polk Elec. | 3,971,970 | 4,133,248 | 0 | 4,133,248 |
| E-line Terminal | 0 | 0 | 654,170 | 654,170 |
The capital costs included in this Amendment are planning estimates from Muni's Construction Division. They include construction costs as well as design and management costs, and a 75-100% contingency, which is standard at this stage.
It is important to note that these costs do not account for additional costs that are integral to project design, implementation, and operation:
§ New vehicles. A new bus costs between $350,000 (40-foot motor coach) and $875,000 (articulated trolley coach). New vehicles may not be necessary to operate the proposed service, because in many cases the projects save operating time, so that it would not require purchasing additional vehicles. However, implementation of BRT may include the deployment of a different type of vehicle, in which case the capital cost of that project would expand to include new vehicles. One important decision Muni must make is whether to operate BRT service with low-floor buses.
§ Streetscape and urban design elements and pedestrian improvements. The capital cost estimates for the Geary and Van Ness projects include a budget for landscaping, but the other projects do not. It is probable that smaller TPS projects, when they are fully designed, will include streetscape elements that are not included in the cost estimates cited here. These elements could be funded out of a non-transportation funding source, as was the case for the $4.5 million streetscape budget in the K-line rerail project.
§ Community outreach and education. Every project of any size requires extensive outreach to the public to solicit input on the project design and to keep the public informed as the project moves along. For instance, the Third Street Light Rail Project will spend an estimated $7 million on public outreach, the jobs program, and other community work by the time it is completed. Other projects will likely require a smaller budget than Third Street, but the costs are significant.
§ In addition to project-specific outreach, other systemwide improvements such as real-time information or Proof of Payment (POP) would require a citywide public education campaign. There are also costs for outreach and public education on Muni's improvements, projects in the Vision document, parking, and other transportation issues. A comprehensive citywide campaign is estimated to cost at least $1 million.
§ Costs for safety engineering are not specifically called out in the projects' capital costs. This is an integral part of the project development process, but the capital cost estimates do not include any safety-related capital improvements that might result from safety engineering. These improvements could also add operating and maintenance costs, which are not quantified.
§ Electrification projects could include the cost of undergrounding other utilities along the alignment. This would help alleviate concerns about the visual impact of the overhead wires.
§ Associated scheduling. The cost for changing a route, which involves before and after data collection, data analysis, and creating new schedules, is estimated at about $26,000 per route.
§ Land acquisition for substations and new facilities. These costs vary widely depending on location and space needs.
§ Operating costs incurred during construction. This may be covered by the contingency in the project budget, but is sometimes overlooked in project planning and budgeting, forcing the regular operating budget to cover these costs.
§ Costs for fare collection. The operating and capital costs for Proof of Payment and/or wayside ticket vending machines are not included in these capital cost estimates.
Capital costs for the projects are summarized in the Funding Needs Summary, Figure 10.
The estimated operating costs for the proposed improvements were developed using data Muni reported to FTA each year for the National Transit Database (NTD) report. The NTD hourly rates are calculated for each mode by dividing operating expenses by revenue hours, and are broken down into Vehicle Operations, Vehicle Maintenance, Non-vehicle Maintenance, and General & Administrative (G&A). The operating costs were derived by multiplying the number of vehicle-hours of service by the NTD hourly operating cost, less the G&A portion. The G&A costs were subtracted from the NTD average because while those costs will increase somewhat with the construction and operation of these projects, they will not increase proportionately with vehicle-hours.
Figure 4: National Transit Database Operating Costs
| Motor Coach | Trolley Coach | Light Rail | Cable Car | |
| Operations Total | $155,529,774 | $106,392,102 | $97,243,929 | $33,658,323 |
| General & Administrative | $27,205,228 | $19,625,640 | $16,551,852 | $5,762,502 |
| Operations Less G&A | $128,324,546 | $86,766,462 | $80,692,077 | $27,895,821 |
| Revenue Hours | 1,405,628 | 1,015,643 | 518,097 | 128,899 |
| Cost per Rev Hour Less G&A | $91.29 | $85.43 | $155.75 | $216.42 |
The incremental difference between current operating costs and those associated with the project is calculated by multiplying the number of vehicle-hours by the percentage of time saved, by the Vehicle Operations portion of the NTD average. The incremental cost difference affects only the vehicle operations; maintenance costs are not expected to change significantly since the vehicles travel the same number of miles.
For those projects that are estimated to have ridership increases, operating costs are added to account for the cost of running more service to accommodate more riders. The vehicle-hours are assumed to increase by 50% of the ridership increase, based on the reasoning that because approximately 50% of the daily ridership is in the peak, peak-period vehicle-hours must increase by 50%. At other times of the day and in non-peak directions it is assumed that there is capacity available to absorb the new riders. The additional service needed is the number of vehicle-hours multiplied by 50% of the ridership increase, multiplied by the NTD minus G&A.
Cycle times for each line are taken from current Muni schedules for the PM peak. The time savings due to TPS improvements were developed with Muni and DPT staff.
These operating costs do not account for the number of vehicles saved or other related cost savings. They do not include owl service. Additional operating cost items not captured by this methodology are those associated with additional trainers, schedulers, and traffic checkers. Also these projects will construct new facilities to maintain (boarding islands, traffic signal pre-empts, real-time information equipment, etc.), the costs for which will be borne by the operating budget.
Another additional factor that may affect the number of vehicle-hours is increased demand for service with school dismissals throughout the City. The system is also faced with a PM peak that lasts later into the evening, requiring more vehicle-hours.
New riders to the system will also increase Muni's fare revenue, which currently averages $0.44 per unlinked trip. This adds up to over $111,000 for every 1,000 new weekday trips. For example, the new riders on the Geary BRT could generate over $900,000 annually.
Although a project may save operating dollars, Muni's operating budget will not in fact decrease. The reality is that those dollars will be used to cover increased maintenance associated with the project or enhance service elsewhere in the system. Thus Muni will become more efficient and provide more, higher quality service to our patrons.
Operating costs for the projects are summarized in the Funding Needs Summary, Figure 10.
Muni assessed the cost effectiveness of the proposed new projects, although this measurement is not required by the settlement agreement. The agreement clearly states that we should prioritize the projects according to our established criteria, which does not factor in cost effectiveness.
For the BRT and TPS projects, a cost effectiveness measure was developed based upon on the type of figure required by the FTA for evaluating New Starts projects. This figure reflects the incremental annual cost for each new rider generated by the service improvement. The cost effectiveness measure is calculated by dividing the total incremental cost of the new project by the number of annual new riders estimated for the project.
The total incremental annual cost is determined by adding the annualized capital and annualized incremental operating costs. The annualized capital cost is calculated by dividing the project's total estimated capital cost by 20 years, the assumed lifespan of the project. The annualized incremental operating cost is calculated as the difference between the estimated cost of the new service and the existing operating cost of the service.
The number of annual new riders for the project is estimated by first projecting the number of daily new riders generated by the new project and then multiplying this number by Muni's annualization factor of 313. This factor is consistent with Muni's historical data and analysis that correlates a route's daily ridership with its annual ridership and adjusts for the differences between weekday and weekend ridership.
By dividing the total incremental annual cost of the new project by the annual new riders estimated to be generated by the project, this measure of cost effectiveness focuses on the costs of new riders only, although the new project would also benefit existing riders. The FTA is moving toward another type of measurement, the "Transportation System User Benefit," that accounts for benefits to all system riders.
It is very important to note that these figures are for comparison purposes only. Only the Geary and Van Ness projects are likely to be eligible for New Starts funding; the TPS projects are not eligible for that funding source, so that their favorable cost effectiveness figures do not indicate that they can be funded that way.
The following table shows the projects with their cost per rider figures. The total annual costs do not account for major repairs and other infrastructure maintenance costs mentioned previously such as boarding islands, traffic signal pre-empts, or real-time information equipment.
Figure 5: Cost Effectiveness of Proposed Projects (Cost Per New Muni Rider)
| Project | Total Capital Cost (Amount in thousands) | Annualized Capital Cost (Amount in thousands) | Annual Incremental Operating Cost (Amount in thousands) | Annualized Cost of Project (Amount in thousands) | Annual New Riders | Estimated Cost per New Rider |
| Geary BRT | $126,000 | $6,300 | $250 | $6,550 | 2,098,352 | $3.12 |
| Van Ness BRT | $74,000 | $3,700 | $30 | $3,730 | 1,624,157 | $2.30 |
| 19th Avenue BRT | $2,400 | $120 | $2,600 | $2,720 | 316,443 | $8.60 |
| Stockton-Columbus TPS | $9,100 | $455 | -$570 | -$115 | 655,735 | -$0.18 |
| N-Judah TPS | $8,000 | $400 | $150 | $550 | 611,289 | $0.90 |
| L-Taraval TPS | $9,100 | $455 | $60 | $515 | 264,798 | $1.94 |
| M-Ocean View TPS | $2,300 | $115 | $140 | $255 | 351,812 | $0.72 |
| Potrero-San Bruno | $5,100 | $255 | -$130 | $125 | 173,402 | $0.72 |
| Fillmore-16th TPS | $25,900 | $1,295 | -$380 | $915 | 306,740 | $2.98 |
| K-Ingleside TPS | $7,000 | $350 | $160 | $510 | 282,952 | $1.80 |
| J-Church TPS | $5,300 | $265 | $60 | $325 | 171,211 | $1.90 |
| 19-Polk TPS | $9,600 | $480 | -$260 | $220 | 79,502 | $2.77 |
| Geneva TPS | $5,600 | $280 | -$80 | $200 | 57,592 | $3.47 |
| Market TPS | $4,200 | $210 | ||||
| Folsom TPS | $5,200 | $260 | -$190 | $70 | 24,101 | $2.90 |
As might be expected, the BRT projects, with the highest capital costs, show the highest cost per new rider. However, those figures would be very competitive with other proposed projects in the New Starts program. Of the TPS projects, the Fillmore-16th Street project has a high cost per rider because it includes constructing overhead wires on a portion of the route, which is more capital-intensive than other TPS improvements. The 19-Polk, Geneva and Folsom projects have the highest cost per new rider numbers among the TPS projects because they are expected to have relatively small numbers of new riders. These two corridors are expected to gain more new riders in a longer time frame, when land uses change along the corridors.
The following are phases of large-scale projects. They are conservative estimates, and projects could be finished more quickly than indicated. It is important to note here that for large-scale projects, funding must be allocated to the project before the planning phase can begin.
Conceptual Planning: This first step is to identify and develop projects conceptually. This includes work internally but also with other agencies, and in particular, the affected communities. The duration of this phase varies with the complexity of the proposed project and the level of support among the residents and businesses along the corridor.
Environmental Assessment: All projects are assessed for environmental impacts. Many transit projects are exempt from a full environmental assessment document, in which case this phase is relatively brief. However, major projects with extensive impacts are required to produce an Environmental Impact Statement. This analysis and public process can take up to 18 months.
Conceptual Engineering: The next step for implementing a major BRT project is to produce a conceptual engineering report. This document fully defines the scope of the project and identifies the parameters for preliminary engineering. Production of this report for a major project can take between 18 and 24 months, possibly longer depending on the scale of the project.
Preliminary Engineering: Depending on the funding strategy developed for a project, Muni may need to take several administrative steps before commencing preliminary engineering. This may include adoption of the project into MTC's Regional Transportation Plan and approval of the proposed action by the FTA for New Starts funding. Preliminary engineering takes between 12 and 18 months.
Final Design: This phase takes at least 12 months and possibly longer depending on the complexity of the project and the comprehensiveness of the conceptual engineering and preliminary engineering previously performed. As a point of reference, the Muni Third Street Light Rail project required three years for Final Design.
Construction: At least 18 months should be expected for construction. TPS projects involving smaller scale improvements could be constructed in a shorter time frame. Muni must also account for time for the bidding and award process.
It is possible to fully implement a BRT project in five years after funding is in place and assuming there is no public opposition. However, the extensive public involvement and consensus building process that would be required to address any public opposition can take 12-18 months. Therefore, the full process for a complex BRT project can be as long as seven years from the time that funding is allocated for planning and outreach work. Key issues affecting a BRT project's implementation schedule include, in addition to the extensive public involvement phase, the design and construction of new grade separations, changes in traffic flow capacity and curbside parking, construction of new bus stops, design modifications to the roadway and medians, and reconfiguration of utility infrastructure.
Generally, TPS treatments can be implemented in a time period of 1.5 to 3 years. However, like the BRT projects, planning, environmental assessment and public outreach must be performed before a realistic implementation schedule can be developed. Any major alterations to traffic flows or parking capacity may require greater time allocations for public process.
Given the more modest type of physical change involved with TPS, it is assumed that these projects do not require a conceptual engineering report and that implementation can begin with preliminary engineering. Engineering may take between 6 and 12 months for operational changes such as retiming traffic signals or establishing signal priority systems. More capital-intensive changes, such as the construction of new bus bulbs, boarding islands, or transit lanes, require additional time.
Certain TPS improvements like operational changes may not require design and can proceed directly to implementation. Physical changes to the roadway and affected infrastructure may take six months or longer.
As with final design, certain TPS improvements may not require any construction. Minor changes may take six months and considerably longer for major construction or for the installation of electrification infrastructure.
Electrification projects can be implemented on a timeline similar to TPS projects. Like TPS projects, electrification projects can be implemented within five years. The public outreach process and environmental analysis would focus primarily, but not exclusively, on the visual impact of overhead wires and modification of utilities.
Muni's ITS department conducted the demographic analysis for these projects. For each project, census block groups within a quarter-mile of the proposed project were selected. For each corridor, population, race, national origin, and income were analyzed using 2000 U.S. Census data. In addition, population density was calculated for each corridor as a whole by dividing the number of persons by the total acreage, including streets and parks and other non-developed lands. This results in what seems to be very low densities - the whole City of San Francisco has 26 persons per acre - so the population density figures in this analysis should be used for comparison purposes only, and not as an expression of the true density.
Figure 6 shows a summary of demographic characteristics of the project corridors. Detailed breakdowns of the categories and census tract maps can be found in Appendix C.
| Project/Corridor | Total Population | Population Density (persons per acre) | Median Income ($) | % White | % Black | % Am. Indian/ Alaska Native | % Asian | % Native Hawaiian Pacific Islander | % Some Other/ Two or More | % Hispanic |
| San Francisco Citywide | 776,733 | 25.73 | 55,221 | 49.7 | 7.8 | 0.4 | 30.8 | 0.5 | 10.8 | 14.1 |
| Geary BRT | 135,359 | 40.93 | 35,918 | 49.7 | 7.6 | 0.5 | 34.4 | 0.2 | 7.5 | 8.1 |
| Van Ness BRT | 186,767 | 46.51 | 45,918 | 51.0 | 4.4 | 0.6 | 25.9 | 0.3 | 17.8 | 26.8 |
| 19th Avenue BRT | 73,572 | 19.33 | 61,767 | 46.9 | 3.8 | 0.2 | 43.3 | 0.2 | 5.6 | 5.3 |
| Stockton-Columbus TPS | 88,862 | 47.12 | 45,004 | 54.6 | 3.3 | 0.4 | 37.0 | 0.2 | 4.5 | 5.3 |
| N-Judah TPS | 79,707 | 25.32 | 61,395 | 62.4 | 4.5 | 0.4 | 25.7 | 0.2 | 6.9 | 7.5 |
| L-Taraval TPS | 34,836 | 24.07 | 66,297 | 46.0 | 1.1 | 0.2 | 47.6 | 0.1 | 4.9 | 5.2 |
| M-Ocean View TPS | 57,405 | 23.18 | 62,920 | 36.3 | 10.1 | 0.3 | 41.2 | 0.3 | 11.7 | 15.3 |
| Potrero-San Bruno TPS | 67,907 | 21.77 | 57,477 | 33.0 | 12.3 | 0.6 | 32.9 | 0.8 | 20.5 | 28.1 |
| Fillmore-16th TPS | 91,802 | 29.54 | 58,196 | 64.8 | 11.0 | 0.6 | 12.2 | 0.2 | 11.2 | 15.2 |
| K-Ingleside TPS | 42,735 | 20.10 | 68,598 | 42.3 | 7.7 | 0.3 | 39.2 | 0.3 | 10.3 | 13.6 |
| J-Church TPS | 59,673 | 46.13 | 60,853 | 71.0 | 4.9 | 0.7 | 9.1 | 0.2 | 14.1 | 20.1 |
| 19-Polk TPS | 117,513 | 23.60 | 37,997 | 51.9 | 12.9 | 0.7 | 22.9 | 1.0 | 10.7 | 13.3 |
| Geneva TPS | 68,095 | 24.80 | 57,549 | 28.9 | 8.5 | 0.4 | 46.0 | 1.0 | 15.3 | 21.1 |
| Market TPS | 75,950 | 37.89 | 35,838 | 56.4 | 9.4 | 0.9 | 21.6 | 0.4 | 11.2 | 14.5 |
| Folsom TPS | 32,112 | 17.03 | 40,431 | 48.5 | 10.0 | 1.0 | 23.9 | 0.3 | 16.2 | 22.7 |
| 47-Van Ness Elec. | 90,506 | 32.33 | 47,916 | 58.1 | 6.2 | 0.6 | 26.5 | 0.3 | 8.4 | 10.1 |
| 9-San Bruno Elec. | 126,592 | 24.62 | 39,403 | 36.2 | 11.8 | 0.7 | 33.1 | 0.9 | 17.2 | 23.2 |
| 19-Polk Elec. | 117,513 | 23.60 | 37,997 | 51.9 | 12.9 | 0.7 | 22.9 | 1.0 | 10.7 | 13.3 |
| E-line Terminal | 21,827 | 14.39 | 61,241 | 63.4 | 4.1 | 0.3 | 26.9 | 0.2 | 5.1 | 5.3 |
The Geary project is one of Muni's highest priorities. Geary, one of the two heaviest Muni corridors in San Francisco, traverses the City from downtown through the Richmond District to the ocean. It includes Geary and Clement streets, both major commercial streets. Destinations along this corridor include the Kaiser medical facilities, UCSF's Laurel Heights campus, Japantown, and Union Square, the Financial District, and the Transbay Terminal. The Richmond District is also one of San Francisco's largest residential areas. The corridor is served by the 38-Geary, 38-Limited, and peak hour expresses as well as parallel lines on Clement, Balboa, and California.
Ridership numbers bear out the importance of the Geary corridor: the 38-Geary local line is among the most heavily traveled of all Muni lines (about 9 million annually). The four Geary routes together carry over 15.5 million riders annually; taken together, the Richmond lines account for 31.3 million rides annually.
Geary is in the Four Corridors Plan and has been the subject of many studies, including the original BART system plan. Muni conducted a Geary Corridor Planning study in 1995, which recommended three alternatives: 1) light rail, all-surface configuration; 2) light rail, surface configuration west of Laguna, subway east of Laguna; and 3) trolley coach, surface configuration west of Laguna, subway east of Laguna. Muni elected not to move forward until a viable financial plan could be developed, and did not select a preferred mode and alignment.
While ideally this corridor would ultimately be served by light rail, it is important to make incremental improvements when possible. This is one of the guiding principles in the Vision document and points toward the implementation of BRT as an interim measure. The investment made in building BRT would be applied toward LRT.
For the purposes of this analysis, Geary BRT service is designed as a skip-stop service, with "A" and "B" buses each stopping at every other stop, except at major transfer points where both would stop.
Both A and B buses would make transfer stops on Market, at Union Square, Jones/Leavenworth, Van Ness, Fillmore, and Divisadero. All service would stop at Presidio. West of Presidio, both A and B buses would stop at Arguello, 6th Avenue, Park Presidio, 25th, 33rd, 37th, and 40th avenues. The A service also stops at Collins, Commonwealth/Stanyan, 9th Avenue, 21st, and existing stops west of 40th Avenue to Point Lobos. Meanwhile, the B stops at Spruce, 3rd, 17th, and 29th avenues, and stops west of 40th Avenue to Fort Miley.
The Geary Local would continue to operate at all existing stops from the Transbay terminal to Presidio and terminate there. The express services would remain as they are.
The project would build an exclusive transitway in the center of Geary from 33rd Avenue to Collins, and concrete curbs to separate transit from traffic between Collins and Gough. A viaduct would be built at Fillmore to cross the street at grade. The Fillmore station would be built on this viaduct, though there is a potential problem with vertical clearance for vehicles passing under the station.
Viaduct structures would also be built between Divisadero and Presidio and between Masonic and Collins to allow buses to stay in the center lane at grade without being required to merge into the right lane. The median west of Masonic would be demolished and replaced with new landscaping on either side of the center lane transitway. The BRT service would run in this median transitway while local service would remain in the right lane. East of Van Ness, the project builds 23 bus bulbs at all existing stops that do not currently have a bulb. The possibility of converting Geary to two-way operation should be considered.
Of all of these projects, the Geary BRT project is estimated to attract the most new riders to Muni. The current annual ridership of 14.7 million on the local and limited combined is expected to increase by 14.3%, adding 2.1 million new riders to the corridor. In addition, implementation of a real-time information system would increase ridership by another 5%.
The capital cost for this project is $126 million. This total includes major construction costs for the viaduct over Fillmore ($8.4 million) and the viaducts crossing Presidio ($19 million). Another substantial cost is the construction of the transitway and stops in the western portion and replacement of most of the existing landscaping ($26 million).
The annual operating cost for the BRT and local service together is $15.7 million, virtually the same as current operating costs ($15.5 million).
Implementation of the Geary BRT is expected to take six to seven years. A great deal of planning and environmental work must be done for this project, since it is almost as complex as a rail project. Even though some planning work has been accomplished, the next step of planning requires funding. The timeline allows a year for conceptual planning and 18 months for environmental documents, some of which is concurrent with the planning phase. Conceptual engineering is likely to take 18 months; preliminary engineering and final design will each take 12 months. Construction is likely to last about 18 months.
Demographics along the Geary corridor are similar to those of the City as a whole. It is 50% white, 8% black, and 34% Asian. It has a smaller proportion of Hispanics (8%). The corridor contains 17% of the City's population at a density of 41 persons per acre, so it is an appropriate corridor for a large transit investment. In addition, Geary is seen as the subject of a specific planning initiative, with significant opportunities for housing and neighborhood improvement, as well as a comprehensive urban design approach to Geary itself.
The project described and analyzed is one possible configuration for infrastructure improvements and a service plan, and does not preclude other solutions that might arise in the project development process. There are many issues that must be addressed, among them changes in parking regulations along Geary and the design and visual impact of the viaducts. The signal priority issue on Geary as it relates to signal priority on major cross streets such as Park Presidio and Van Ness, which are also important transit arteries, must be resolved.
BRT on Van Ness, one of the Four Corridors in the SFCTA plan, is the other major priority for Muni. Van Ness is a designated state highway, and although it appears to be relatively auto-oriented, the adjacent blocks have up to 100 housing units per net acre, among the highest residential densities in the U.S. Mission Street itself is an important commercial street, surrounded by relatively dense, relatively low-income residential areas. As a result, there are a high percentage of transit-dependent residents and ridership is quite heavy along this corridor.
Muni operates several trolley coach and motor coach lines on Mission (14, 49, 67) and Van Ness (47, 49), for a total ridership of about 31 million annual riders. The Van Ness lines cross every east-west line in the northern half of the City; Golden Gate Transit also uses Van Ness. During peak hours, the 47 and 49 each run every seven minutes on Van Ness and the 14-Mission runs every 5 minutes on Mission, so service is quite frequent. However, buses on Mission and Van Ness experience delays due to high levels of congestion, making reliability an issue.
This project would address general congestion on Van Ness by creating an exclusive transitway in the center of Van Ness Avenue, separating buses from other traffic using raised medians, landscaping, and boarding platforms. The boarding platforms would improve overall system accessibility. This project also builds 51 bus bulbs along Mission Street and assumes the signal priority project currently under construction. Service frequencies and hours of operation would remain the same.
Consolidating a few stops would also speed up service. New stops would be located at Union, Broadway/Pacific, California/Sacramento, Sutter/Post, Geary/O'Farrell, Golden Gate/Turk, Hayes, and Market.
This project, because it decreases travel time significantly on Van Ness, is expected to attract over 1.6 million (19.8%) annual new riders to the system on the 47 and 49 lines, which together carry 8.2 million riders today. With real-time information, this would increase another 5% for a total increase of 25%.
The capital cost for the Van Ness project is $74 million. The transitway includes the cost of new landscaping along the length of this alignment as well as the cost of relocating the overhead wires to the center of the street. One consideration is that the overhead infrastructure on Van Ness is scheduled to be replaced in the next ten years, so that the overhead portion of the project could be funded and constructed in conjunction with the transitway project. In fact, because the cost of the overhead work could be allocated to the overhead program, this project's overall capital cost could be less than the estimate and thus more cost effective. However, the entire $74 million capital cost would be required to build the project in a five year time frame.
The annual operating cost for the 47 and 49 lines is $12.6 million. The cost of providing a substantial amount of additional service to accommodate the new riders (including those attracted by real-time information) is offset by the cost savings due to decreased travel time. The net incremental operating cost, $30,000, is negligible.
Implementation of the Van Ness BRT and TPS improvements on Mission is expected to take up to seven years. As with Geary, this project will require a great deal of planning and environmental work. The timeline allows 24 months for planning and environmental, 18 months for conceptual engineering, 12 months for preliminary engineering, and 12 months for final design. Construction is likely to last about 18 months.
Van Ness is almost twice as dense as the City average, at 47 persons per acre. The median income in this corridor is also somewhat lower than the City as a whole, and has a substantial number of Hispanics (27%) who are probably concentrated in the Mission District portion of this corridor. There are fewer African-Americans and Asians in this corridor.
Planning Department staff consulted with Muni and included the Van Ness transitway in the Market/Octavia Better Neighborhoods Plan. There are also many traffic and operational issues to be resolved with Caltrans and DPT.
19th Avenue is the primary north-south artery in the western half of the City. It is designated a state highway and carries large numbers of automobiles. Many of them travel through the City from Marin to the peninsula, but it serves a number of key destinations in San Francisco: the Presidio, Golden Gate Park, Stern Grove, San Francisco State University and Stonestown Mall. The corridor is served by the 28-19th Avenue and the 28-Limited, with 12-minute headways and a combined ridership of approximately 4.7 million riders annually. The 29-Sunset runs parallel on Sunset Boulevard.
The project analyzed for this effort is BRT operation in center HOV lanes, shared with high-occupancy cars and other transit vehicles, on 19th Avenue. Another possible configuration for the service is for the BRT to remain in the right lane, with greatly enhanced stops with bus bulbs, ticket vending machines, and other passenger amenities. There are benefits and drawbacks to each of these scenarios.
The HOV operation can potentially save more time than right side operation, since there are relatively fewer conflicts with turning movements. The lane would also be restricted to high occupancy vehicles, so there would be less congestion in the lane. Center lane operation also lays the groundwork for eventual light rail along 19th Avenue, and may allow for some landscaping. However, center lane operation raises safety concerns since passengers would have to cross half of 19th Avenue, which is wide and fast moving, and wait on an island in the middle of high volumes of traffic. In addition, passengers would have to cross the street to transfer between BRT and local services. The HOV lane would also require enforcement. Caltrans and DPT have expressed concerns about traffic impacts caused by an HOV lane because 19th Avenue is the busiest street in San Francisco.
In terms of service, the 28-Limited would become a BRT service and run in the center HOV lane from Eucalyptus to Lake, with island stops at California, Geary, Balboa, Fulton, Lincoln, Irving, Judah, Noriega, Quintara, Taraval, and Sloat. Signals would be timed and stations would be situated to minimize red light time, but it is understood that general car movement is also important and that may realistically control the signals. Current signal timing on 19th Avenue is for peak direction traffic progression, and this is effective for the current 28L in the peak direction. Initially, the BRT would run at 10-minute frequencies and the local would remain as it is. Additional demand could require additional service.
This project is estimated to increase ridership on 19th Avenue by 7% over the current annual ridership of 4.5 million. Real-time information system is expected to add another 3% in this corridor.
The capital cost for this project, which includes painting HOV lanes and constructing 26 boarding islands, is $2.4 million. The annual operating cost for the BRT is estimated at $3.4 million, which is substantially higher than the operating cost for the 28-Limited, which is $800,000. The difference is due to the fact that the BRT is proposed to operate everyday for 19 hours a day, while the existing limited operates for only 4.5 hours on weekdays.
Implementation of the BRT on 19th Avenue is expected to take five years. The timeline allows 24 months for planning and the complex environmental work. However, the project as described will not require as much time for engineering and construction since the proposed improvements are simpler than the other BRT projects. The timeline includes 9 months each for conceptual engineering, preliminary engineering, and final design. Construction is expected to take 12 months.
This corridor has a greater proportion of Asians (43%) than the rest of the City (31%). Asians make up the predominant minority in this corridor, as there are fewer African-Americans and Hispanics. This corridor is somewhat more dense (27 persons per acre) than the rest of the City.
North Beach and Chinatown are among the City's densest neighborhoods and attract many U.S. and international visitors. The area is well-served by Muni, with the 30-Stockton and 45-Union Stockton trolley lines, the 15-Third, San Bruno expresses, and cable cars. However, very narrow streets and high levels of congestion make it very difficult for transit vehicles to maintain schedules. This project would build bus bulbs along the 30-Stockton alignment on Chestnut, Columbus and Stockton; signalize intersections to allow signal priority; and extend overhead wires to Marina Boulevard. This overhead project is likely to meet opposition from neighboring residents. Left turns would be restricted at selected locations on Chestnut. Pedestrian scramble signals should also be explored in Chinatown since the area has a very heavy volume of pedestrians, which can affect transit movements. This makes Stockton a good candidate for transit priority signal timing improvements.
Due to the many competing needs for the public right-of-way in this corridor, taking a lane of traffic for exclusive transit use may not be feasible. It should also be noted that part of this alignment is identical to the proposed Central Subway alignment. That project, planned to be in service in 2009, will build a subway to connect Third Street light rail with SOMA and Chinatown along Stockton to Clay Street. Local bus service would still operate on the surface so these improvements would still be necessary and useful.
Current annual ridership is 8.3 million on the 30 and 6.05 million on the 45. These ridership numbers are estimated to increase by 5% and 4%, respectively, since the improvements, particularly the bus bulbs, will help reduce travel time through this congested corridor.
The capital cost for this project is $9.1 million. The annual operating cost for the 30 and 45 combined is estimated at $12.2 million, $570,000 less than current operating costs for the two lines. Although vehicle hours will expand to carry the additional riders, the cost savings due to lower travel times more than offset the costs for increased service.
Implementation of these TPS improvements is expected to take approximately three years. This generally allows a year for planning and environmental work, a year for engineering and final design, and a year for construction. The planning work for this project is expected to be very complex due to the density of uses and interests in the corridor.
Chinatown is one of the lowest income areas of San Francisco, and its residents tend to be transit-dependent. This corridor has a higher proportion of Asians (37% compared to 31%) and whites than the City (55% compared to 48%), and fewer African-Americans and Hispanics. It is almost twice as dense as the rest of the City, with 47 persons per acre and lower median income ($45,000 compared to $55,000 citywide).
The project for the N-Judah includes two new island stops at Funston and La Playa, signalization of four-way stop intersections, upgraded signals, and concrete curbs to separate the trackway from other traffic on Irving and Judah west of 19th Avenue. For ten blocks between 9th and 19th avenues, the N-Judah operates in a physically separated right-of-way that prevents autos from interfering with rail operations, but easily allows cross traffic at intersections and emergency access. This project would continue that facility west of 19th, improving reliability for the N. Elements not included in this project, but feasible to do in the short term, are minor changes to parking regulations and curb treatments to physically prevent illegal parking in specific locations with very small clearances.
The improvements are expected to have a significant impact on reliability west of 19th Avenue, which affects large numbers of riders on the rest of the line. The current annual ridership of 12.2 million is estimated to increase by 5%.
The capital cost for this project is $8 million. The annual operating cost to operate the line is estimated at $12.4 million, slightly higher than current costs. Although the project will save travel time and thus operating costs, an additional $150,000 is needed to accommodate the increased ridership.
Implementation of these TPS improvements is expected to take approximately three years. This generally allows a year for planning and environmental work, a year for engineering and final design, and a year for construction.
This corridor has a higher proportion of white people than the City (62% compared to 48% citywide), and fewer minorities. It is of average density (25 persons per acre) and has a slightly higher median income than the City as a whole.
This project provides island stops at locations on Taraval, special pavement treatments within the trackway to distinguish it from the regular roadway, and upgraded signals for signal pre-emption. Left turn movements would be restricted at certain locations along Taraval. The L-Taraval is scheduled for rail replacement in 2006, which presents a good opportunity to coordinate this project with the regularly programmed rerail project.
The left turn restrictions, speeded transit, and potential parking changes will be issues that must be addressed with the community. Faster transit speeds, while desirable for passengers and the City as a whole, present a potential safety concern with pedestrians crossing the street. However, it is possible to address these concerns.
This line carries 8.8 million people each year, and the proposed project to improve reliability is estimated to increase ridership by 3%.
The capital cost for this project is $9.1 million. The annual operating cost to operate the line is estimated at $9.3 million, slightly higher than current costs. Although the project will save travel time and thus operating costs, a net additional $60,000 is needed to accommodate the increased ridership.
Since these improvements are likely to be implemented as part of the rerail project, the timeline will depend on the timeline of that larger project.
The demographics of this corridor include a significantly higher percentage of Asians (48%, compared to 31% citywide) and lower percentage of African-Americans and Hispanics. It has a higher median income ($66,300) than the City as a whole.
The M-Ocean View project would provide upgraded signals and "Keep Clear" markings at key locations to improve travel time and reliability. The M-line runs in an exclusive median between Eucalyptus and Junipero Serra, but effective grade crossing protection is needed as it crosses 19th Avenue at Eucalyptus. The City should take over control of a Caltrans-controlled light at Eucalyptus and incorporate it into the progression. In addition, "Keep Clear" markings are needed at this intersection to prevent cars from blocking LRV crossing movements. That element of the project can be done immediately, given funding, since it is a relatively low-cost, uncontroversial project.
Because this project could have a major effect on reliability, ridership is estimated to increase by up to 4% with the project. Current annual ridership on the M is 8.8 million.
Muni submitted a community planning grant to review the M-line service, and in particular, to develop a better terminus, which is currently sub-par at the Geneva Yard.
The capital cost for this project is relatively low, at $2.3 million. The annual operating cost to operate the line is estimated at $9.7 million, slightly higher than current costs. Although the project will save travel time and thus operating costs, an additional $140,000 is needed to accommodate the increased ridership.
Implementation of these TPS improvements is expected to take at least three years. This allows a year for planning and environmental work, a year for engineering and final design, and a year for construction. However the crossing at 19th Avenue may trigger a full environmental review.
This segment of the M serves a population that is predominantly minority (41% Asian, 10% black, 15% Hispanic). Its median income is higher than the citywide average while densities are slightly lower.
This corridor includes a number of residential neighborhoods as well as many commercial and industrial employment clusters. The 9-San Bruno serves the length of this corridor, supplemented by the 9X, 9AX, and 9BX express lines. These lines combined carry 11.9 million riders per year. The 33-Stanyan operates on Potrero between 16th and 24th streets, with an annual total line ridership of 2 million. As with the Folsom corridor, this corridor is included in anticipation of some growth and further development, which would justify a higher level of investment in the transit infrastructure. However, that development is not expected to happen in the next five years, and thus, this project is less capital intensive and involves TPS-type improvements.
The project includes 34 bus bulbs, signal timing on Potrero and San Bruno, and signalization of the all-way stops along San Bruno with priority for buses. The project proposes to limit left turns on this alignment, particularly on San Bruno where there is only one lane in each direction.
The 9-San Bruno, the primary route serving this corridor, has an annual ridership of 5.8 million, and this number is expected to increase by 3% with the improvements described.
The capital cost for this project is $5.1 million and the annual operating cost is $7.2 million, $130,000 lower than current costs.
Implementation of these TPS improvements is expected to take approximately three years. This allows a year for planning and environmental work, a year for engineering and final design, and a year for construction.
This corridor is among the most heavily minority of the corridors included in this analysis, with only 33% whites. The area is 33% Asian, 28% Hispanic, 12% black, and 15.5% of other races.
The Fillmore section of this route has the highest ridership of the line, but buses experience more delays on this half because there is only one lane in each direction, with parking and turning movements blocking transit vehicles. This project proposes to eliminate stops at Jefferson, North Point, Cervantes, O'Farrell, Turk, Golden Gate, and Steiner/Green; provide 60' bus bulbs at all remaining stops; and improve signal priority along the length of Fillmore. The project proposes to eliminate all left turns on Fillmore. Since that is likely to be controversial, it is possible to begin with peak-hour restrictions on left turns. Installation of bus bulbs would result in a net gain in parking spaces, since bulbs are shorter than bus zones.
The 16th Street project includes 16 bus bulbs in the Mission section of the street and 14 island stops in the eastern section, a raised concrete right-of-way from Utah to Third Street, signal work, and electrification east of Kansas Street. It is necessary to resolve how electrified Muni service will cross the Caltrain tracks.
This route is the first bus line to be equipped with a real-time passenger information system, which informs passengers at selected bus stops when the next two buses are expected to arrive. This has been very popular with riders.
Ridership effects were analyzed for the two projects together. If both projects were implemented, ridership on the 22-Fillmore, currently 7.7 million, could increase as much as 4%.
The capital cost for these projects combined is $26 million, $9.1 million for the Fillmore section and $16.8 million for the 16th Street section. The annual operating cost to operate the 22 with both projects is estimated at $5.9 million. The cost savings due to lower travel times offset the costs for increased service and could result in a potential savings of $380,000.
Implementation of these TPS improvements is expected to take approximately four years. The timeline is longer than for other TPS projects because of the technical issue of Muni's electrified line crossing Caltrain tracks, and because the traffic changes on Fillmore are likely to be controversial.
The combined corridor of Fillmore and 16th Street has a higher proportion of whites (65% compared to 48% citywide), and African-Americans (11% compared to 8% citywide). It is somewhat denser than the City (29 persons per acre) and has a slightly higher median income than the City as a whole.
This portion of the K-Ingleside, from St. Francis Circle to its terminal at Green Yard, is currently under construction for regular rail replacement, upgraded stops, and streetscape and other amenities. Therefore, the project includes fewer elements. The major element of this project is providing concrete curbs and speed bumps (to delineate the exclusive lanes across intersections) to create an exclusive transitway. Other elements include a fully accessible high-level boarding platform at West Portal and 14th Avenue, upgraded signal work to allow pre-emption, and a new stop at Howth. The platform at West Portal and 14th Avenue is outside the scope of the settlement project list, but is included here as a relatively small project that would enhance travel time and safety.
This new stop at Howth, included in the Better Neighborhoods plan for Balboa Park, is a long-range proposal that would be implemented when City College opened a new accessible entrance on Ocean Avenue across from Howth. The new stop would replace the existing stop, which is reached from City College via an overcrossing and a staircase. This project would construct a new stop at Howth, rebuild the north sidewalk at the new stop, and demolish the existing stop, leaving the pedestrian overcrossing. Left turn movements would be restricted at certain locations along Ocean.
As with the J-Church, it is possible that the neighboring communities will oppose the left turn restrictions and any parking changes that may be proposed. There is also a safety concern with speeding transit vehicles.
The K carries 5.7 million people annually, and this project is estimated to attract 5% more new riders because of the improved reliability due to the exclusive transit lane operation.
The capital cost for this project is $7 million. This figure does not include the cost of acquiring ROW at Howth or moving the tracks on West Portal to accommodate the center platform at 14th Avenue. The annual operating cost to operate the line is estimated at $9.6 million, which is approximately $160,000 higher than current operating costs. The difference is due to increased vehicle hours needed to accommodate the additional riders.
Implementation of these TPS improvements is expected to take approximately three years. This allows a year for planning and environmental work, a year for engineering and final design, and a year for construction. As mentioned, if the tracks must be moved at West Portal and 14th Avenue, the timeline would be considerably longer.
The demographics of this corridor include more Asians and fewer whites than citywide. It is also considerably less dense (20 persons per acre) and has a higher median income ($68,600) than the City as a whole.
The majority of the J-Church service, as with other light rail lines, is on surface streets in mixed flow through areas of medium density housing and neighborhood commercial districts. This segment of this route has a number of all-way stop signs that add running time, as well as turning movements and parking regulations that interfere with transit movement. Rail vehicles are particularly prone to delays due to automobile interference, since they cannot maneuver around obstacles.
This project builds concrete island stops at locations where they do not currently exist on Church and 30th for improved passenger safety and convenience, and provides concrete curbs and low profile speed bumps along both sides of the trackway so as to encourage automobiles to stay out of the rail ROW. The project would also signalize seven intersections that currently have stop signs, and upgrade signalization at all intersections to allow LRVs to pre-empt the signals. In particular, Muni would work with DPT to install a "smart priority" signal at Church and Market. Left turn movements would be restricted at certain locations along Church. In particular, the outbound stop at 22nd Street should be relocated so as to accommodate all four doors on the Breda vehicles.
It is possible that the neighboring communities will oppose the left turn restrictions and any parking changes that may be proposed. There is also a safety concern with speeding transit vehicles.
The J-Church has an average annual ridership of 4.3 million. This project, which will improve reliability and decrease travel time slightly, is expected to generate a 4% increase in ridership.
The capital cost for this project is $5.3 million. The annual operating cost to operate the line is estimated at $8.4 million, which saves approximately $60,000 due to the slightly lower travel time. Additional operating savings are anticipated since the F-Market and N-Judah trains use the J-Church alignment for pull-ins and pull-outs.
Implementation of these TPS improvements is expected to take approximately three years. This allows a year for planning and environmental work, a year for engineering and final design, and a year for construction.
This route serves a corridor that is predominantly white (71%), with small proportions of African-Americans (5%) and Asians (9.1%). The population is 20% Hispanic. The corridor is almost twice as dense as the rest of the City and the median income is slightly higher.
This project would build 34 bus bulbs primarily along the northern half of the alignment where congestion is an issue, and upgrade signals to allow signal priority along Polk, Seventh, and Eighth streets. Improvements on this portion of the route will help improve reliability on the entire line.
Ridership on the 19-Polk, currently almost 4 million, is estimated to increase by 2% with this project.
The capital cost for this project is $9.6 million and the annual operating cost is estimated at $5.7 million, $260,000 lower than current costs.
Implementation of these TPS improvements is expected to take approximately three years. This allows a year for planning and environmental work, a year for engineering and final design, and a year for construction.
This corridor is about 52% white, with about 13% black, 23% Asian, and 13% Hispanic. The corridor has a higher proportion of African-Americans and lower proportion of Asians and Hispanics than citywide.
This project would allow buses to operate in dedicated median lanes defined by a raised concrete right-of-way on Geneva Avenue from Howth to Schwerin. The project would provide island stops along that alignment, and install and upgrade signals to allow signal priority along this stretch. Transit movement around the Cow Palace between Schwerin and Santos must be protected. The segment of Ocean from Howth to Junipero Serra (with the exclusive right-of-way for the K) is addressed in the K-line project above.
The project anticipates the possibility of a light rail extension on Geneva. Currently, the Geneva-Ocean corridor passes through relatively low-density residential neighborhoods and a number of small commercial districts, but this area is anticipated to see some changes. The Baylands in Brisbane will be developed; Visitacion Valley residents have initiated a planning process; and the Better Neighborhoods plan, a cooperative planning effort that could result in added residential density around Balboa Park, a revitalized Ocean Avenue commercial corridor, and possible development on the site of the Balboa reservoir near City College. A recently completed Bi-county Transportation Study recommended an extension of Third Street Light Rail eastward into Candlestick Point rather than west to Balboa Park.
The improvements on this corridor are expected to have a relatively small impact on ridership, 1%, since buses do not experience severe delays on Geneva.
The capital cost of this project is $5.6 million, and the annual operating cost of the 9X-San Bruno Express, which will be the primary route on this corridor when the 15-Third is discontinued, is estimated at $3.1 million. That figure is approximately $80,000 less than current operating costs.
Implementation of these TPS improvements is expected to take approximately three years. This allows a year for planning and environmental work, a year for engineering and final design, and a year for construction.
This corridor is heavily minority, with 46% Asians (31% citywide), 21% Hispanics (14% citywide), and 8.5% African-Americans (7.8% citywide). Median household income and population density are comparable with citywide numbers. The census tracts in Daly City were not available for this demographic analysis.
Market Street is San Francisco's spine, serving as the heart of the business and retail centers of the City, a regional and local transit hub, the symbolic focal point of the City, a key view corridor, a celebration space for major public events, and a growing residential district. It is a high density, fully built out corridor with many major destinations - The Embarcadero and Ferry Terminal, Financial District, Union Square, theater district, and Civic Center; further west are medium density neighborhood commercial and residential uses. Market Street is extremely transit-rich - Muni Metro and BART run below grade, and the F-Market streetcar line and numerous bus lines operate on the surface. All five Metro lines, the F, and six bus lines serve the segment between Van Ness and The Embarcadero, providing extremely frequent service. Ridership on Muni is very high on Market; eleven surface lines travel on Market at some point, accounting for over a quarter of Muni's weekday ridership.
Congestion with autos on Market results in delays, and more importantly, reliability issues, particularly east of 5th Street. Many pedestrians, bicyclists, delivery vehicles, taxis, and other transit vehicles also compete for space on the street. These delays reverberate throughout the system, affecting reliability. Another operational issue with the F-Market is that it jogs to the right side of the street to avoid the Franklin left turn lanes. This is a potential safety issue and creates reliability and safety problems for the F-line. The new Central Freeway will touch down at Market and Octavia and has the potential to deposit more vehicular traffic on Market Street.
The overall goal on Market is to reduce delays to transit caused by autos. This can be done by diverting auto trips to other streets (without impacting Mission Street), and restoring transit-based signal timing. Transit on Market Street could operate most efficiently in a physically separated ROW, especially between Van Ness and The Embarcadero. However, there are significant questions of how this could occur on Market Street, given the volume of transit vehicles and the need to maintain access for other vehicles and modes.
The San Francisco County Transportation Authority is conducting a planning study of Market Street with input from a broad range of transit, bike, and pedestrian advocates, and City staff. The study's goals are to improve pedestrian safety, transit efficiency and access, and bicycle mobility, and to accommodate motor vehicles in a way that ensures Market Street's commercial and residential viability.
Because Market Street is an extremely complicated corridor with numerous transit lines, and because there is an ongoing study to address these issues and develop recommendations, this analysis did not focus on potential projects and ridership gains on Market. This project recommends only a special paving treatment for the transit lane along the entire length of Market, at a capital cost of $4.2 million. This does not suggest that all transit must be limited to the center lanes. Operating costs were not analyzed because the quantitative impact of such a project on travel time for so many lines is difficult to capture.
Installing the special paving treatment is expected to take approximately a year. The project's timeline will depend on the ability to maintain service along the right-of-way while repaving the transit lane.
The Market Street corridor shows a higher proportion of whites and African-Americans, and fewer Asians. The median income of $35,900 is only 65% of the citywide average of $55,200. At the same time, this corridor is much denser than the rest of the City, with 37.9 persons per acre.
Folsom Street is included in the Vision document and in this list of projects because it is considered to be a high-growth corridor. Indeed, the South Of Market area (SOMA) developed rapidly in the past decade, with the new Giants ballpark, the completion of the Yerba Buena redevelopment project, and many new offices, residences, and entertainment facilities. In the long term, with a new Transbay Terminal and Federal Building, Folsom will become a major spine for SOMA.
In the five-year time frame of this set of projects, however, the corridor will not require such a focused capital investment. Rather, it is more appropriate to improve conditions for the 12-Folsom route as it currently exists. The project includes 26 island stops on Folsom and Harrison and improved signal priority. This project description is in effect a TPS-level project, but does not preclude eventual implementation of BRT, possibly along a two-way Folsom "boulevard." This idea will be further discussed in the context of planning for the Transbay Terminal and the Downtown Plan.
The project is expected to increase ridership by approximately 2%, though since ridership on the 12 is low (1.2 million annually), the number of new riders is also low.
The capital cost for this project is $5.2 million and the annual operating cost is estimated at $6.2 million, $190,000 lower than current costs.
Implementation of these relatively straightforward TPS improvements can be completed within three years. This allows a year for planning and environmental work, a year for engineering and final design, and a year for construction, but is likely to take less time.
As mentioned, this corridor has a relatively low population and low density. The population mix in this corridor is more Hispanic and less Asian than in the City as a whole.
This project would construct overhead and other infrastructure at the ends of the 47-Van Ness route to allow trolley coach operation. This line was operated with trolley coach until the SOMA service changes in 2001, and thus almost 60% of the current route is already under wire. Partly because of this, the 47 is a primary candidate for electrification in the Route Electrification Study.
Van Ness is also proposed for a Bus Rapid Transit project with exclusive transit-only lanes in the center of the street; that project is described below. Electrification of the 47 could affect the effectiveness of the BRT in this corridor, since both lines using the transitway would then be electrified and unable to pass if necessary.
Annual ridership on the 47 is 2.1 million. The electrification project alone is not expected to affect ridership measurably.
The capital cost for this project is $30 million. The annual operating cost to operate the line as a trolley coach line is estimated at $6.8 million, which is approximately $460,000 less than its operation with motor coach.
This electrification project is expected to take approximately three years. The bulk of this time is for engineering and final design and construction.
This corridor is about 58% white, with about 6% black and 26% Asian, and 14% Hispanic. The corridor is among the denser in the City, with 33 persons per acre.
This project would electrify the portion of the 9-San Bruno route that currently operates on streets without existing overhead wires. This comprises approximately two-thirds of the route and includes the route south of 24th Street and in SOMA. This project is also identified as a primary candidate in the Route Electrification Study.
The 9-San Bruno carries 5.8 million riders annually. The electrification project alone is not expected to affect ridership measurably.
The capital cost for this project is $52.5 million. The annual operating cost to operate the line as a trolley coach line is estimated at $7.2 million, which is approximately $490,000 less than its operation with motor coach.
This electrification project is expected to take approximately three years. The bulk of this time is for engineering and final design and construction.
This corridor is about 36% white, with about 12% black and 26% Asian, and 23% Hispanic, a significantly higher proportion of minorities than San Francisco as a whole.
This project would electrify the entire 19-Polk line. Most of this line operates on streets without existing overhead wires, so a large capital investment would be required. The Potrero Hill community is in general support of electrification projects; however, there would be fairly serious operational issues on Potrero Hill that could limit the desirability of electrifying this line. This project is identified as a secondary candidate in the Route Electrification Study.
The 19-Polk carries 4 million riders annually. The electrification project alone is not expected to affect ridership measurably.
The capital cost for this project is $72 million. The annual operating cost to operate the line as a trolley coach line is estimated at $5.8 million, which is approximately $400,000 less than its operation with motor coach.
This electrification project is expected to take at least three years. The bulk of this time is for engineering and final design and construction. Because this route requires a large amount of new overhead, construction is likely to take over a year.
This corridor is about 52% white, with about 13% black and 23% Asian, and 13% Hispanic. The corridor has a higher proportion of African-Americans and lower proportion of Asians and Hispanics than citywide.
Since the demolition of the freeway, The Embarcadero has enjoyed a renaissance into one of San Francisco's most beautiful boulevards. It serves a number of major destinations, such as Fisherman's Wharf, the Ferry Terminal, Pacific Bell Park, and the Caltrain Terminal. In addition, the Port of San Francisco is planning and developing a number of projects on the piers, including office and entertainment uses and a cruise ship terminal. The corridor also has a growing residential presence.
As part of the F-Embarcadero extension to Fisherman's Wharf, connecting tracks were built on The Embarcadero between the F-Market tracks north of Mission Street, and the Muni Metro tracks south of Folsom Street. These tracks give Muni the ability to operate rail service along the entire waterfront, from Fisherman's Wharf to the Caltrain Terminal at Fourth & King Streets.
This project would build a loop track and replacement tail tracks at the end of the existing tail tracks at the southern end of the Metro tracks, near Sixth Street and Berry. This would allow more efficient operation of the light rail system and accommodate historic streetcar operation along this corridor. The terminal loop is the last major element in operating the historic "E-line" service from the Caltrain Terminal to Fisherman's Wharf. Four stops are expected to be constructed adjacent to the four Metro stations by 2004.
The E-line service is conservatively estimated to carry 650,000 riders per year. This number is based on all-day service at 15-minute frequencies, but does not account for special event ridership along the corridor, such as for baseball games, and does not account for full build-out in Mission Bay.
The capital cost for the terminal is $12 million. However, E-line operation would also require rehabilitating up to ten historic streetcars in addition to the 25 already in daily service. Each major rehabilitation of a streetcar costs an estimated $2 million, so that the total capital cost to operate the E-line is $32 million. The annual operating cost for this service is estimated at $10 million.
The terminal loop has already gone through conceptual engineering. The project is still expected to take approximately three years for preliminary engineering, final design, and construction, since it must be constructed without impacting existing service.
This corridor is characterized by commercial, industrial, and entertainment uses, so residential density is quite low. The area is predominantly white (63%) and has lower proportions of all minorities than the City as a whole.
The following projects are not mentioned in the settlement agreement, but they could increase ridership substantially.
Muni's Schedules section conducted a Schedule and Headway Adherence Study to determine if the current scheduled running times on all Muni lines is adequate for the conditions encountered in everyday operation. The analysis found that an overall increase in the number of peak vehicles - 21 trolley coaches and 17 motor coaches - is required to provide the existing service levels. These additional vehicles would not provide additional service, but rather be used to maintain the existing schedule, as running times have lengthened. At approximately $350,000 for a 40-foot motor coach and $600,000 for a 40-foot trolley coach, the capital cost alone to address this deficit is $18.6 million. Operator costs to run this additional peak demand are estimated at $2.4 million annually. In addition, the expanded fleet will require additional resources to be dedicated to maintenance. By creating new schedules and expanding the fleet, Muni could significantly improve reliability for passengers.
In 1999, Muni contracted with a vendor for a demonstration project of an automatic vehicle location (AVL) system, based on global positioning system (GPS) technology. The two-year pilot project uses AVL on Muni's light rail fleet and on the 22-Fillmore line. This pilot project provides information through a variety of media, including the Internet and bus shelter signs, to both Muni patrons and operations personnel, on the real-time location and predicted arrival of Muni Metro vehicles and the 22-Fillmore. This passenger information system has proven to be very popular with Muni patrons, and of great benefit to Muni operations. A second pilot project from a different vendor has installed a similar GPS-based system on Muni's cable cars for the purpose of gathering data on vehicle locations at specific time points, for subsequent analysis and performance monitoring. The data from both pilot projects provides more complete and accurate fleet performance information than has previously been achieved, at a much lower cost.
Muni is now planning for a new AVL system that would be introduced throughout the entire fleet and route network, and that would provide real-time vehicle arrival predictions for passengers as well as operational and performance data for Muni. The new system would incorporate the features of both highly successful GPS/AVL pilot programs into a single system that would serve Muni's needs and improve customer service well into the future.
The firm that provided the demonstration project on the Metro and 22-Fillmore lines is under contract to start implementation of the real-time passenger information system on all of the rail and cable car routes. Displays will be installed at selected stops; exactly which stops are to be served shall be determined during the detailed design phase. This would include a public website and be compatible with internet-capable cellular phones and other devices.
Currently, only $2.7 million is programmed for this $9.7 million project. Muni is seeking the additional $7 million required to equip the rest of the trolley and motor coaches and install 400 displays. Additional funding beyond the $7 million would be required to provide enhanced services and displays at all stop locations.
Proof-of-payment fare collection (POP) permits passengers to purchase fares prior to boarding, thus expediting passenger boarding and reducing dwell time. Passengers are required to have in their possession a ticket, transfer or transit pass. Fare inspectors can request to see proof of payment, and passengers without it are subject to a fine. POP is currently in place in the entire Muni Metro system. This system speeds boarding and requires only one operator for a two-car train on the Metro system.
It is possible to implement POP on a line-by-line basis or systemwide. Systemwide implementation would be less confusing to riders, but that would require a large number of inspectors. Alternatively, since POP is most effective on lines with heavy ridership where dwell times cause significant delay, it would be more economical to expand POP by mode - to include BRT lines in addition to Metro, for example.
If operating funds were available for more fare inspectors, POP could be implemented in the short term on lines with heavy ridership, such as the 38-Geary and 15-Third. In FY 2003, the annual cost to deploy fare inspectors is $350,000 per Metro line. However, that figure is reduced because of recent budget cuts, and supports an inadequate level of enforcement on Metro. The level of enforcement on buses is also expected to require more inspectors than on Metro. Therefore the cost to implement POP on buses is expected to be greater than $350,000 per line.
When POP was first implemented on the Metro lines, overall fare revenues remained fairly constant systemwide, without a decline as feared by some. In terms of violations and revenue from citations, Muni has collected approximately $4,000 monthly from fines during the first two years of POP. There are several reasons for the relatively low revenue figure. Muni only receives a portion of the citation revenue that is collected. There is a fairly high compliance rate - an estimated 60-70% of Metro riders hold a Fast Pass. In addition, early data indicated that only 30% of citations were paid.
Proof of Payment would be compatible with the regional fare payment system called TransLink, sponsored by MTC. Muni is currently participating in the demonstration phase of the system. With this system, customers use a smart card to pay for fares on all forms of public transit in the Bay Area. Riders can now use TransLink on all Muni Metro lines. Depending on the results of the demonstration, TransLink will be implemented in additional locations in late 2003. When fully implemented, TransLink will be accepted on most Bay Area transit systems.
Low floor buses are desirable because they speed boarding and reduce dwell times. They are also easier for seniors and many disabled persons because they allow level boarding, making lifts unnecessary and saving most lift maintenance costs. There are no systemic differences in terms of grade and ground clearance issues between high and low floor buses. Many transit agencies around the country have converted to low-floor bus operation.
While low floor buses are easier to use for most passengers, they can present concerns for wheelchair users. Currently, buses are equipped with a lift to accommodate wheelchairs. On low-floor buses, a ramp extends from the bus floor to the sidewalk or street. Many existing stops in San Francisco are pole stops where it is impossible for the bus to pull up to the curb, making it difficult and unsafe for many wheelchair users to traverse the steep ramp from the street into the bus. The lack of a curb adds 6-8 inches in vertical height that must be traveled to reach the bus floor, making the grade of the ramp extremely steep. Lift deployment at pole stops, while more difficult than at a stop with a curb, does not present the problem of the steep grade that must be negotiated with a ramp.
There is also the issue of interior design and maneuverability for wheelchairs. Muni's current bus lifts are 36" wide, exceeding the ADA requirement of 30" minimum width. It is critical to maintain these high standards and procure buses that have enough room in the boarding area, whether that is in the front or in the rear, to accommodate large wheelchairs. Some seating capacity is sacrificed in order to create enough space for passenger boarding and the wheel wells.
It is possible to use low-floor buses to operate the BRT projects, where all the stops will be new or rebuilt at bus bulbs or islands. While this might limit Muni's flexibility with the fleet, it is an option for further consideration.
This legislation would amend the vehicle code to require vehicles to yield the right of way to buses signaling to reenter the traffic stream. This rule is common in Europe and has been adopted in Washington, Oregon, Florida, and British Columbia. California has a pilot program in effect at Santa Clara Valley Transportation Authority and Santa Cruz Metropolitan Transit District.
The rule is typically advertised on the rear of buses. Even if only one vehicle yields, this can significantly reduce merging delay. The Oregon version of the rule reads as follows: "1) The driver of a vehicle shall yield the right of way to a transit vehicle traveling in the same direction that has signaled and is reentering the traffic flow. 2) Nothing in this section shall operate to relieve the driver of a transit vehicle from the duty to drive with due regard for the safety of all persons using the roadway." The significant benefits include decreased travel time for passengers, greater reliability, and less stress for operators.
This is primarily a legislative effort, but Muni would incur associated costs for public awareness, modification of buses to advertise the legislation, and operator training.
The 2002 Capital Improvement Program (CIP) is a set of projects Muni plans to undertake to replace, rehabilitate or enhance system assets. This CIP covers a 20-year period from FY2002-2021. Capital projects are major investments in rolling stock or in the physical plant and are costs that would not normally be covered in the operating budget. The CIP will be updated in 2003 as part of the 2004-2023 SRTP.
The projects included in the CIP are prioritized using a four-step process that considers program criteria, specific project criteria, project schedule and readiness, and funding availability. This priority establishes the order in which the estimated $6.6 billion in project costs are funded using the $6.1 billion projected revenues for the total CIP, including projects that began before 2002. Refer to the 2002-2021 SRTP for detailed information about the existing CIP, program, criteria, and methodology.
For this Amendment, the prioritization process is identical to the existing CIP process, except that ridership effects were taken into account. Some of these projects were already in the CIP; for example, the E-line terminal is already included in the CIP though it is not fully funded in the next 20 years.
The major changes in the CIP are the creation of two new programs, the BRT program and the TPS program. As each project within the program becomes more developed, it will become a separate item in the CIP with different criteria.
All of the projects and programs fall in the Infrastructure Program of the CIP, so that is the only program presented in this Amendment. The criteria for ranking the programs and projects are described in detail in the 2002-2021 SRTP. Criteria as they apply to the settlement projects are discussed below.
Projects and programs are considered "Ongoing/Committed" if construction or procurement is already underway or there are explicit public commitments from a direct action by the Municipal Transportation Agency Board or the Board of Supervisors. This criterion applies to the electrification program because some of the projects in the program, particularly for Mission Bay, are considered committed.
For the purposes of this set of projects and programs, those that are expected to have impacts on ridership or reliability receive a checkmark for Proposition E, since they will help meet standards set forth in Proposition E.
All of these projects enhance existing infrastructure and facilities, so they receive the "Enhance Existing" checkmark. Finally, the electrification and MMX terminal improvements are considered expansion projects so they also receive the "New/Existing" check.
As noted, the E-line Terminal, also referred to as the MMX terminal, is already included in Muni's CIP as a stand-alone project.
Figure 7 shows the Infrastructure Program of Muni's CIP with the settlement projects and programs as discussed in this Amendment in boldface.
| Project Name | Ongoing / Committed | Legally Man-dated | Safety Need | Deterio-rated Asset | Accessi-bility | Prop. E Standard | Regular Replace-ment | Enhance Existing | New / Expan-sion |
|---|---|---|---|---|---|---|---|---|---|
| Metro Accessibility Program | X | X | X | ||||||
| Subway Electrical Improvements | X | X | X | ||||||
| Advanced Train Control System | X | X | X | X | |||||
| TPS - Bus Stop Improvements | X | X | X | X | |||||
| Overhead Rehab 1998-2009 | X | X | X | X | X | ||||
| Rail Replacement 1998-2009 | X | X | X | X | |||||
| Cable Car Infra. Rehab FY98-09 | X | X | X | ||||||
| Automatic Vehicle Location Sys | X | X | X | ||||||
| Operator Restrooms | X | X | X | ||||||
| Third St-Track/Vehicles/MME | X | X | X | ||||||
| Ocean Ave. Reconstruct. | X | X | X | ||||||
| Route Electrification Program | X | X | X | ||||||
| F-Embarcadero Extension | X | X | |||||||
| Mission & Steuart Hotel Site | X | X | |||||||
| TransLink Demonstration | X | X | |||||||
| Bay Bridge Retrofit Reroute | X | ||||||||
| Electrical Isolate/Sectionalize | X | X | X | ||||||
| Elevator/Escalator Rehab | X | X | |||||||
| Trolley Ext-Mission Bay | X | X | |||||||
| Infrastructure Pres/Imp Program | X | X | X | X | |||||
| Subway Blue-Light Phone Replace | X | X | X | ||||||
| Eureka Portal Rehabilitation | X | X | |||||||
| Subway PA System Replacement | X | X | |||||||
| Van Ness Backup Battery Replace | X | X | |||||||
| Van Ness Uninterruptible Power | X | X | |||||||
| M-Line New Stub Terminal | X | X | X | ||||||
| Subway Seismic Retrofit Study | X | X | |||||||
| Wayside Fare Collection Equip | X | X | X | X | X | ||||
| Radio Comm System & CAD Replace | X | X | |||||||
| Subway Signal Sys Final Cutover | X | X | |||||||
| Accessible Lift Replacement | X | X | X | ||||||
| Subway Stations - Talking Signs | X | X | |||||||
| Overhead Rehab 2010-2019 | X | X | |||||||
| Rail Replacement 2010-2019 | X | X | |||||||
| BRT Program (formerly Rapid Bus Van Ness Transitway) | X | X | |||||||
| TPS Program (formerly Rapid Rail Program) | X | X | |||||||
| TPS - Islands and Bulbs | X | X | |||||||
| TPS - Colored/Textured Lanes | X | X | |||||||
| TPS - Priority Signal Systems | X | X | |||||||
| Third St-Phase II/NCS | X | X | |||||||
| Overhead Rehab 2020-2029 | X | ||||||||
| Rail Replacement 2020-2029 | X | ||||||||
| Subway Restroom Rehabilitation | X | ||||||||
| MMX Terminal Improvements | X | X | |||||||
| Mint Test Track Equipment | X | ||||||||
| Trolley Ext-Presidio | X | ||||||||
| Cable Car Ext. to Fish Wharf | X | ||||||||
| Cable Car Infra. Rehab FY10-19 | |||||||||
| Cable Car Infra. Rehab FY20-29 |
The three electrification projects are in the CIP as part of the Route Electrification Program. Priorities for route electrification projects are established according to the Route Electrification Study discussed above. A draft of this study is available from Capital Planning & Grants staff. The study grouped potential electrification projects into Committed Projects, Primary Candidates, and Secondary Candidates. The settlement projects included in the route electrification study are
§ Electrification on 16th Street (Committed as part of Mission Bay changes)
§ Electrification of 47-Van Ness (Primary)
§ Electrification of 9-San Bruno (Primary)
§ Electrification of 19-Polk (Secondary)
Three projects, for Geary, Van Ness, and 19th Avenue, comprise the BRT program. These projects are ranked according to estimated ridership increases resulting in the ranking shown in Figure 8. Geary has a greater gain in real numbers, but Van Ness is projected to see a larger percentage gain.
The Potrero-San Bruno and Folsom BRT projects on the settlement list are grouped with the TPS projects because they involve TPS-level improvements, such as boarding islands and bus bulbs, and do not include exclusive transit lanes. The BRT on 16th Street is also a TPS-level project in the five year time frame, and is combined with the Fillmore TPS project.
| BRT Project | Current Annual Ridership | New Riders | Percent Gain | Ridership with Project | Ridership with Project and RTI | Capital Cost (Cost in thousands) |
|---|---|---|---|---|---|---|
| BRT on Geary from Pacific Ocean to Van Ness and TPS from Van Ness to Transbay Terminal | 14,681,578 | 2,098,352 | 14.3% | 17,376,061 | 18,110,140 | $126,000 |
| BRT on Van Ness and TPS on Mission | 8,210,929 | 1,624,157 | 19.8% | 10,168,483 | 10,579,029 | $74,000 |
| BRT on 19th Avenue and Park Presidio from Stonestown to Lake | 4,522,850 | 316,443 | 7.0% | 5,022,939 | 5,249,082 | $2,400 |
| Total | 27,415,357 | 4,038,952 | 14.7% | 32,567,483 | 33,938,251 | $202,400 |
The TPS program includes all of the TPS projects and those BRT projects that are estimated to take longer than the five-year timeframe of this settlement agreement. These projects are ranked in order of current ridership since the estimated ridership gains are relatively small. The TPS project rankings are shown in Figure 9. It should be noted that there are existing TPS projects that need funding which are listed under the individual programs of "Bus Bulbs" "Colored or Texturized Lanes" and "Signal Priority."
| TPS Project | Current Annual Ridership | New Riders | Percent Gain | Ridership with Project | Ridership with Project and RTI | Capital Cost (Amount in thousands) |
|---|---|---|---|---|---|---|
| TPS treatments from Stockton/Market to the Presidio through North Beach and the Marina (30, 45) | 14,326,636 | 655,735 | 5% | 15,564,090 | 16,280,422 | $9,100 |
| TPS treatments for N-Judah from Duboce Portal to La Playa (N) | 12,222,963 | 611,289 | 5% | 13,330,553 | 13,941,701 | $8,000 |
| TPS treatments for L-Taraval from West Portal to Wawona/46th Avenue (L) | 8,829,417 | 264,798 | 3% | 9,452,725 | 9,894,196 | $9,100 |
| TPS treatments for M-Ocean View from St. Francis Circle to Green Terminal (M) | 8,791,544 | 351,812 | 4% | 9,500,328 | 9,939,905 | $2,300 |
| BRT on Potrero and TPS on San Bruno (9) | 5,778,293 | 173,402 | 3% | 6,186,317 | 6,475,232 | $5,100 |
| TPS treatments on Fillmore and BRT on 16th Street (22) | 7,665,683 | 306,740 | 4% | 8,283,680 | 8,666,964 | $25,900 |
| TPS treatments for K-Ingleside from St. Francis Circle to Green Terminal (K) | 5,661,231 | 282,952 | 5% | 6,174,052 | 6,457,114 | $7,000 |
| TPS treatments for J-Church from Duboce Portal to 30th Street (J) | 4,281,840 | 171,211 | 4% | 4,626,911 | 4,841,003 | $5,300 |
| TPS treatments on 19-Polk route to Hunters Point (19) | 3,971,970 | 79,502 | 2% | 4,212,750 | 4,411,349 | $9,600 |
| TPS treatments on Geneva from Ocean Bayshore/Sunnydale (9) | 5,778,293 | 57,592 | 1% | 6,070,507 | 6,359,422 | $5,600 |
| TPS treatments on Market Street from Castro to The Embarcadero (F) | $4,200 | |||||
| BRT on Folsom from The Embarcadero to 16th Street (12) | 1,198,790 | 24,101 | 2% | 1,271,567 | 1,331,507 | $5,200 |
| Total | 78,506,660 | 2,979,134 | 3.8% | 84,673,480 | 88,598,813 | $96,400 |
Figure 10 is a summary of all the projects discussed in this Amendment, including the systemwide projects with costs as they are available. All ridership figures are annual.
Figure 10: Funding Needs Summary
| Project | Capital Cost (Amount in Thousands) | Annual Operating Cost (Amount in Thousands) | Incremental Operating Cost (Amount in Thousands) | Current Ridership | Ridership with Project | Ridership with Project and RTI | Increase due to Project and RTI | Incremental Cost per New Rider |
|---|---|---|---|---|---|---|---|---|
| Geary BRT | $126,000 | $15,700 | $250 | 14,681,578 | 17,376,061 | 18,110,140 | 19.3% | $3.12 |
| Van Ness BRT | $74,000 | $12,600 | $30 | 8,210,929 | 10,168,483 | 10,579,029 | 24.8% | $2.30 |
| 19th Avenue BRT | $2,400 | $3,400 | $2,600 | 4,522,850 | 5,022,939 | 5,249,082 | 12.0% | $8.60 |
| Stockton-Columbus | $9,100 | $12,200 | -$570 | 14,326,636 | 15,564,090 | 16,280,422 | 9.6% | -$0.18 |
| N-Judah TPS | $8,000 | $12,400 | $150 | 12,222,963 | 13,330,553 | 13,941,701 | 10.0% | $0.90 |
| L-Taraval TPS | $9,100 | $9,300 | $60 | 8,829,417 | 9,452,725 | 9,894,196 | 8.0% | $1.94 |
| M-Ocean View TPS | $2,300 | $9,700 | $140 | 8,791,544 | 9,500,328 | 9,939,905 | 9.0% | $0.72 |
| Potrero-San Bruno TPS | $5,100 | $7,200 | -$130 | 5,778,293 | 6,186,317 | 6,475,232 | 8.0% | $0.72 |
| Fillmore-16th TPS | $25,900 | $5,900 | -$380 | 7,665,683 | 8,283,680 | 8,666,964 | 9.0% | $2.98 |
| K-Ingleside TPS | $5,600 | $9,600 | $160 | 5,661,231 | 6,174,052 | 6,457,114 | 10.0% | $1.80 |
| J-Church TPS | $7,000 | $8,400 | $60 | 4,281,840 | 4,626,911 | 4,841,003 | 9.0% | $1.90 |
| 19-Polk TPS | $5,300 | $5,700 | -$260 | 3,971,970 | 4,212,750 | 4,411,349 | 7.0% | $2.77 |
| Geneva TPS | $9,600 | $3,100 | -$80 | 5,778,293 | 6,070,507 | 6,359,422 | 6.0% | $3.47 |
| Market TPS | $4,200 | --- | --- | --- | --- | --- | --- | |
| Folsom TPS | $5,200 | $6,200 | -$190 | 1,198,790 | 1,271,567 | 1,331,507 | 7.0% | $2.90 |
| 47-Van Ness Elec. | $30,000 | $6,800 | -$460 | 2,113,689 | 2,199,513 | 2,305,197 | 5.0% | --- |
| 9-San Bruno Elec. | $52,500 | $7,200 | -$490 | 5,778,293 | 6,012,915 | 6,301,830 | 5.0% | --- |
| 19-Polk Elec. | $72,000 | $5,800 | -$400 | 3,971,970 | 4,133,248 | 4,331,847 | 5.0% | --- |
| E-line Terminal | $32,000 | $10,000 | $10,000 | 0 | 654,170 | 686,879 | --- | --- |
| Reliability Improvements | $18,600 | $2,400 | $2,400 | --- | --- | --- | --- | --- |
| Real-Time Passenger Information | $7,000 | --- | --- | 5% | --- | 5.0% | --- | |
| Totals | $510,900 | $153,600 | $12,890 | 117,785,969 | 130,240,809 | 136,162,816 | 11.5% | --- |
The following key steps define the travel time savings and resulting ridership increase for the three BRT corridors:
1. For each corridor, define a segment over which the travel time savings will be realized,
2. Determine the existing travel time for this segment using published schedules;
3. Determine estimated travel times for the BRT/HOV operation in this segment, using estimated travel speeds and estimated boarding/alighting times at each stop;
4. Determine the number of current passengers traveling through this segment by calculating an average load (as a proxy for ridership between segment endpoints) throughout the segment; and
5. Calculate the increase in ridership resulting from the estimated travel time savings, based on the travel time elasticity of demand for transit.
The number of passengers traveling through the BRT segment is estimated as the average of the average daily load at equally spaced stops within the segment. For 19th Avenue, data exist from the 1999 ridecheck.
For Geary, data only exist from the 1996 ridecheck. Therefore, we made a "1996" ridership estimate for the increased ridership and the reallocation of "current" passengers. This estimate was then converted to "1999" numbers, as detailed ridership by route is available for this year, and was used to scale the "1996" numbers. Frequency changes on Geary are marginal, so to be conservative, we assumed no increase in ridership due to frequency of service improvements.
The Van Ness corridor estimate is the least certain of the three corridors for a number of reasons relating to available data. There has not been a comprehensive ride check of Van Ness corridor services since major restructuring took place last year, including the removal of the 42 Downtown Loop from Van Ness. Stop level ridership on the 49 line, which serves two major corridors (Van Ness and Mission) was not readily available, requiring an assumption to be made about the proportion of 49 Line riders benefiting from BRT. To simplify the calculation, we assumed that 50% of 49 Line riders could be affected by the travel time improvements in the corridor, and that those riders would be distributed in the same way as 47 Line riders are distributed in current stop level counts. Because the 49 Line is a very heavily used route, ridership estimates in this corridor are highly dependent on this assumption.
It should be noted that travel time improvements, measured as the speed between stops, are not as significant on the Van Ness corridor as they are on Geary Boulevard. This is due to the number of crossing streets with independent signal progression that limit the benefits of preemption. While the Geary BRT has an average speed between stops of 28 miles per hour, Van Ness is assumed to operate at 20 miles per hour between stops, including dwell times at intersections that are not stops. The frequency of service will not change with the addition of the BRT services and there is no ridership increase attributable to that parameter in the Van Ness corridor.
The ridership results are based on the following assumptions:
| Assumption: | Geary | Van Ness | 19th Avenue |
|---|---|---|---|
| BRT travel speed | 28 mph | 20 mph | 23 mph |
| Wait times at each stop | 25 seconds | 25 seconds | 25 seconds |
| Travel time elasticity of ridership | -0.6 | -0.6 | -0.6 |
| Frequency elasticity of ridership | 0 | 0 | -0.25 |
| Increase in ridership due to real-time information | 5% | 5% | 5% |
| BRT operates until | 1:00 AM | 1:00 AM | 1:00 AM |
| Number of riders on 49 traveling in BRT segment | 9,750 |
AC Transit Alameda-Contra Costa Transit
AVL Automatic Vehicle Location
BART Bay Area Rapid Transit
BRT Bus Rapid Transit
CAP Citywide Action Plan
CIP Capital Improvement Program
CWTP Countywide Transportation Plan
DPT Department of Parking and Traffic
FTA Federal Transit Administration
G&A General & Administrative
GPS Global Positioning System
HOV High Occupancy Vehicle
IOS Initial Operating Segment
ITMS Integrated Transportation Management System
ITS Intelligent Transportation Systems
LRT Light Rail Transit
LRV Light Rail Vehicle
MMX Muni Metro Extension
MTAB Municipal Transportation Agency Board
MTC Metropolitan Transportation Commission
NTD National Transit Database
POP Proof of Payment
ROW Right-of-Way
RTP Regional Transportation Plan
SFCTA San Francisco County Transportation Authority
SOMA South of Market
SRTP Short Range Transit Plan
TCM2 Transportation Control Measure #2
TPS Transit Preferential Streets
Mayor Willie L. Brown, Jr.
San Francisco Board of Supervisors
Municipal Transportation Agency Board of Directors
H. Welton Flynn, Chair
Enid Lim, Vice Chair
Shirley Breyer Black
Mike Casey
Michael Kasolas
Rev. Dr. James McCray, Jr.
Cleopatra Vaughns
Director of Transportation
Michael T. Burns
Development of this Short Range Transit Plan Amendment has involved a large number of individuals associated with the San Francisco Municipal Railway. We would like to thank everyone who was involved for contributing his or her time and effort to develop this plan.
Prepared by the Capital Planning & Grants section of the S.F. Municipal Railway's Capital Planning & External Affairs Division.
Continue to Calendar Item Number 11, Part 2
![]()
©2002 San Francisco Municipal Railway. All rights reserved.
Last updated December 3, 2002